Target Circle Diagram – Information Delivery and Visual Innovation
RJ0600062_14
- Last Update 07/06/2025
- File Size 3.4MB
- # of Slides 2
- File Format PPTX
- Slide Ratio 16:9
- Color
Keywords
About the Product
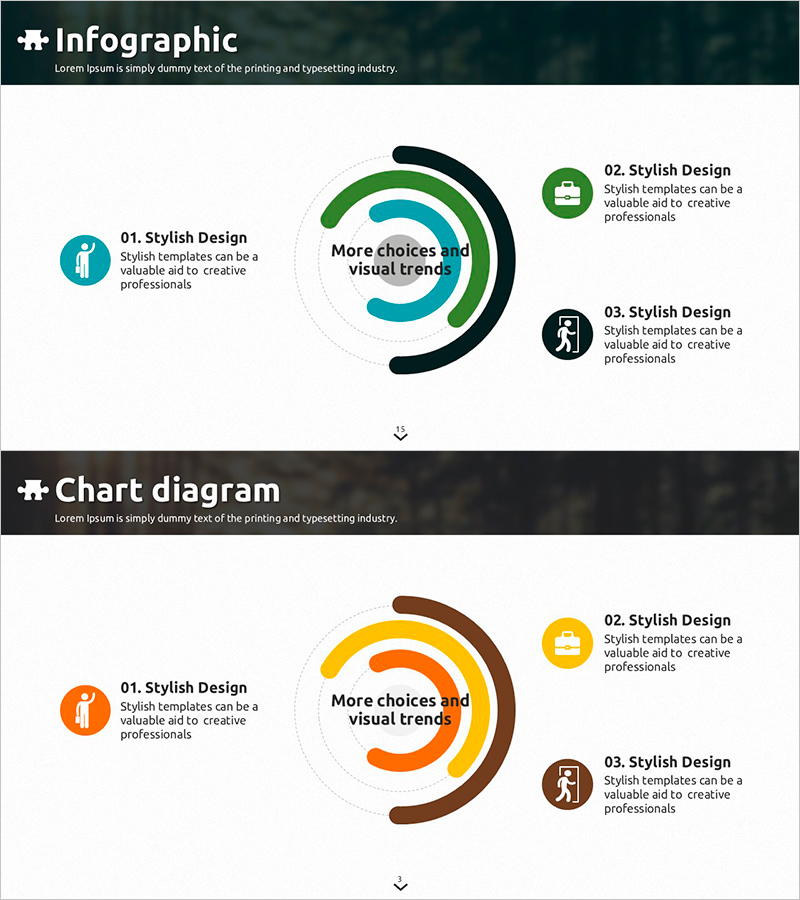
A radial circle diagram PowerPoint slide featuring concentric rings that expand from center to periphery. The design uses teal, green, and black color layers to visualize hierarchical information flow from core message to supporting details. This 2-slide set in 16:9 widescreen format enables immediate customization for corporate strategy, marketing, and project management presentations. The diagram structure supports multi-level data representation and audience comprehension through visual hierarchy.
Usage Points
-
Main Usage
Visualizes information expansion and hierarchical structure radiating from a central concept. Places core message at center and progressively displays related information and details through concentric rings, enhancing audience comprehension. Ideal for strategy, process, and organizational structure presentations.
-
How to Use
Enter core topic in center circle, then populate each ring layer with related items. Use color differentiation to indicate information priority and add icons to reinforce meaning. Directly applicable to executive presentations, strategy meetings, and educational materials.
-
Recommended For
Recommended for executives, marketing teams, project managers, and educators explaining strategy, vision, and processes. Suitable for organizational structure, business domains, customer segmentation, and product positioning scenarios requiring multi-layered information clarity.
-
Slide Structure
2-slide set. First slide features teal, green, and black concentric rings with center text area and 3 icon callout points. Second slide uses orange, yellow, and brown color palette with identical structure for diverse topic representation.
Related Products
-

Business Status Chart – Presentation Template for Market Analysis
#Market and Competitor Analysis #Diagram #Graph
-

Circle Split SWOT Analysis Diagram – New Horizons in Market Analysis
#Market and Competitor Analysis #Diagram #SWOT Analysis
-

Schedule of Highlighter Check Concepts – Effective Business Implementation Strategy
#Business Strategy #Operational Plan #Diagram
-

Budget Diagram by Item – Visual Representation of Budget Planning
#Financial Plans and Performance #Diagram #Capital Requirements
