Development Status Donut Chart – Visualize Progress at a Glance
RJ0600058_7
- Last Update 07/06/2025
- File Size 1.8MB
- # of Slides 2
- File Format PPTX
- Slide Ratio 16:9
- Color
Keywords
About the Product
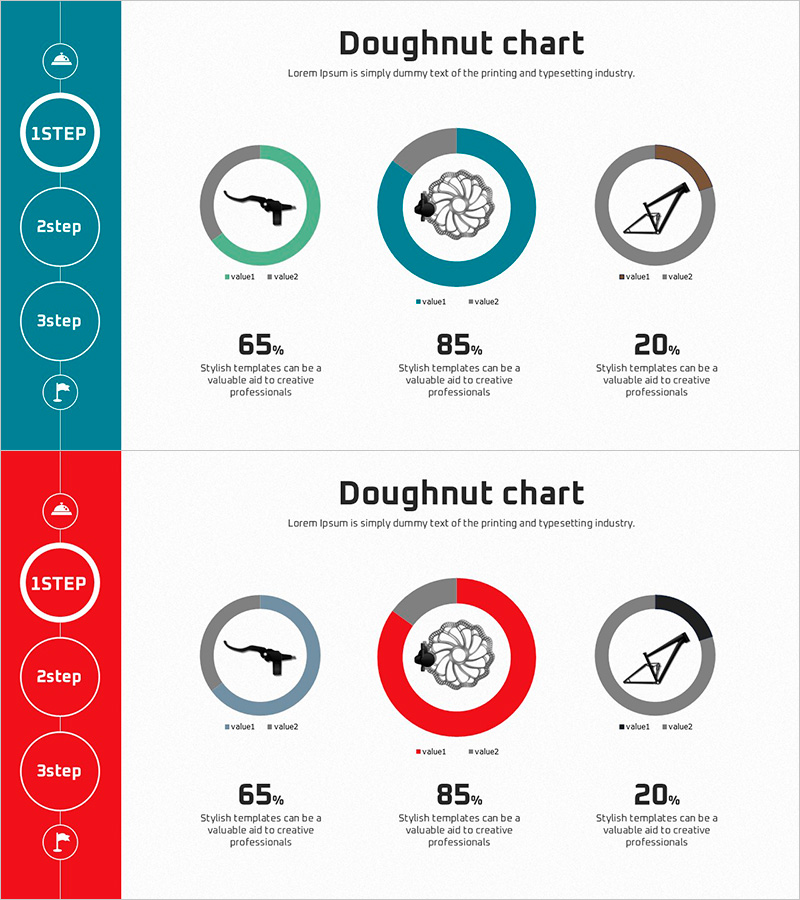
A donut chart PowerPoint slide template designed to visualize development status, project progress rates, and task completion metrics. Available in two color themes—teal and red—each slide features three donut charts paired with percentage values, icons, and descriptive text. The left-side timeline navigation (1STEP, 2step, 3step) enables step-by-step progress representation with clear data labels and legends. This presentation template is ready for immediate use in business reports, status updates, dashboards, and executive presentations.
Usage Points
-
Main Usage
Visualizes three-item ratios such as project progress, development status, task completion, and goal achievement rates using donut chart graphics. The icon and percentage value in the center of each donut chart provide instant status recognition, while the left-side timeline navigation displays step-by-step progression.
-
How to Use
Select either the teal or red color theme to match your corporate brand identity. Replace the percentage values and legend labels with your actual data, and update the left-side icons and text with your project phase names. Insert into presentation slides, monthly or quarterly reports, and dashboard sections to effectively communicate progress status.
-
Recommended For
Project managers, development team leads, marketing professionals, financial analysts, and executives preparing status reports. Ideal for IT project updates, product development phase tracking, marketing campaign performance, budget execution rates, and other business reporting scenarios requiring ratio visualization.
-
Slide Structure
Two-slide set. Each slide features a left-side colored timeline area (teal or red) with circular 1STEP, 2step, 3step navigation and four icons, plus a main right-side area containing three donut charts (each with two data series), percentage values, legends, and descriptive text. 16:9 widescreen format in PPTX with fully editable elements.
Related Products
-

Green Yellow Area Chart – A Fresh Approach to Data Visualization
#Graph
-

Market Share Donut Pie Chart – Insightful Data Visualization
#Product/Service Introduction #Diagram #Graph
-

User Analysis Graph by Age Group – Advanced Data Insights
#Market and Competitor Analysis #Diagram #Graph
-

Market Analysis Graphs & Tables – Visualizing Sales Growth
#Market and Competitor Analysis #Financial Plans and Performance #Diagram
