Aiming Shooting Infographic – Business Strategy and Goal Setting
RJ0600056_18
- Last Update 07/05/2025
- File Size 2.8MB
- # of Slides 2
- File Format PPTX
- Slide Ratio 16:9
- Color
Keywords
- #Content-Based Slides
- #Design-Based Slides
- #Business Vision and Strategy
- #Marketing Plan and Strategy
- #Diagram
- #Business Strategy
- #Target Setting
- #Spread
- #Centralized Diagram
- #16:9
- #radial diagram PowerPoint slide
- #goal setting presentation template
- #business strategy infographic
- #center expansion diagram
- #strategic visualization PPT slide
About the Product
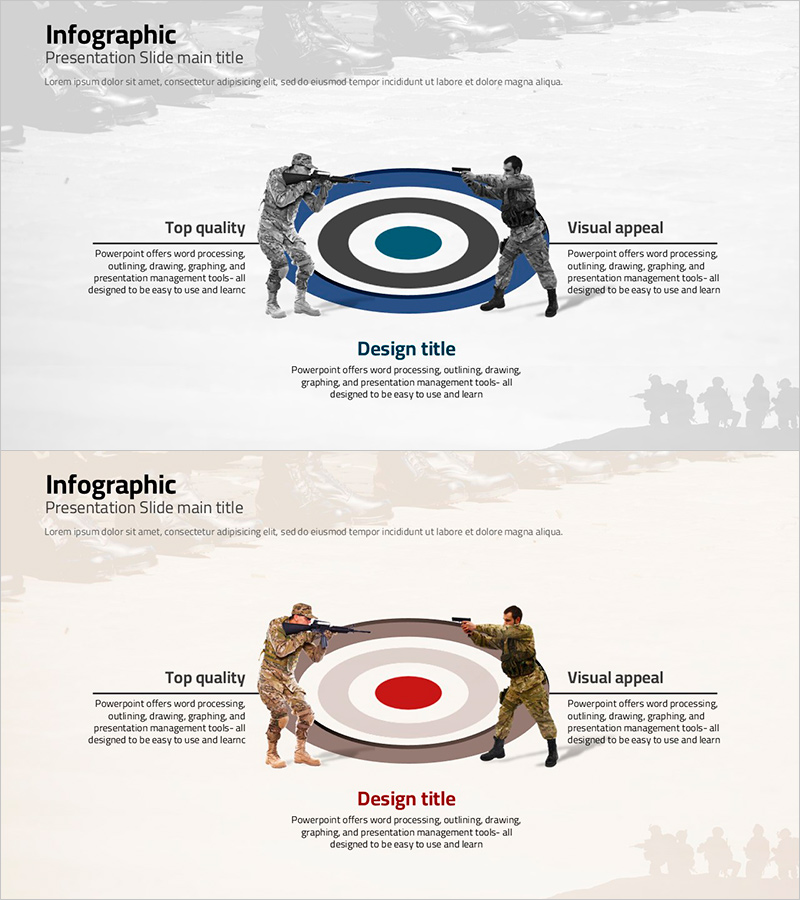
A radial diagram PowerPoint slide that visualizes business strategy and goal setting with a central objective expanding left and right. This presentation template features two color versions—dark blue and white tones, plus brown and beige tones—allowing you to match your corporate brand identity. Each slide includes ample text input areas for strategy directions, action items, and performance metrics, making it ready to edit and present immediately. The 16:9 widescreen PPTX format is optimized for modern presentation environments and works seamlessly across devices.
Usage Points
-
Main Usage
Positions your organization's core objective at the center and expands strategic directions and action items to the left and right. Ideal for executive briefings, strategy planning meetings, and organizational goal-sharing presentations where you need to communicate the relationship between objectives and tactics intuitively.
-
How to Use
Enter your core objective in the central circle, add strategic initiatives and action items in the left text boxes, and performance indicators and expected outcomes in the right boxes. Select the color version that matches your corporate branding, adjust text size and font as needed, and use it as your presentation material.
-
Recommended For
Perfect for executives, strategy managers, organizational development specialists, and project leaders presenting on goal setting, strategic planning, and performance management. Suitable for business plans, management reports, organizational transformation proposals, and strategy planning meeting materials.
-
Slide Structure
2-slide set. Each slide features a central circular node (core objective), 3–4 text boxes on the left (strategic initiatives), and 3–4 text boxes on the right (performance metrics). Arrows and connector lines express the radial expansion from center to both sides. Version 1 uses dark blue, white, and black tones; Version 2 uses brown, beige, and white tones.
Related Products
-

Simple Design Trend Wide PPT Overlapping Diagram
#Business Introduction #Business Vision and Strategy #Diagram
-

Business Goals Aligned with Trip Outcomes – Strategic Success
#Business Vision and Strategy #Diagram #Business Strategy
-

Construction Business Strategy Framework – Growth and Innovation
#Business Vision and Strategy #Technical Approach #Diagram
-

Three Key Elements of Excavator Construction – Vision and Strategy
#Business Vision and Strategy #Operational Plan #Diagram
