Dietary Diet Ingredients PowerPoint Slide – Capturing Health and Change
RJ0600054_13
- Last Update 07/05/2025
- File Size 2.2MB
- # of Slides 2
- File Format PPTX
- Slide Ratio 16:9
- Color
Keywords
About the Product
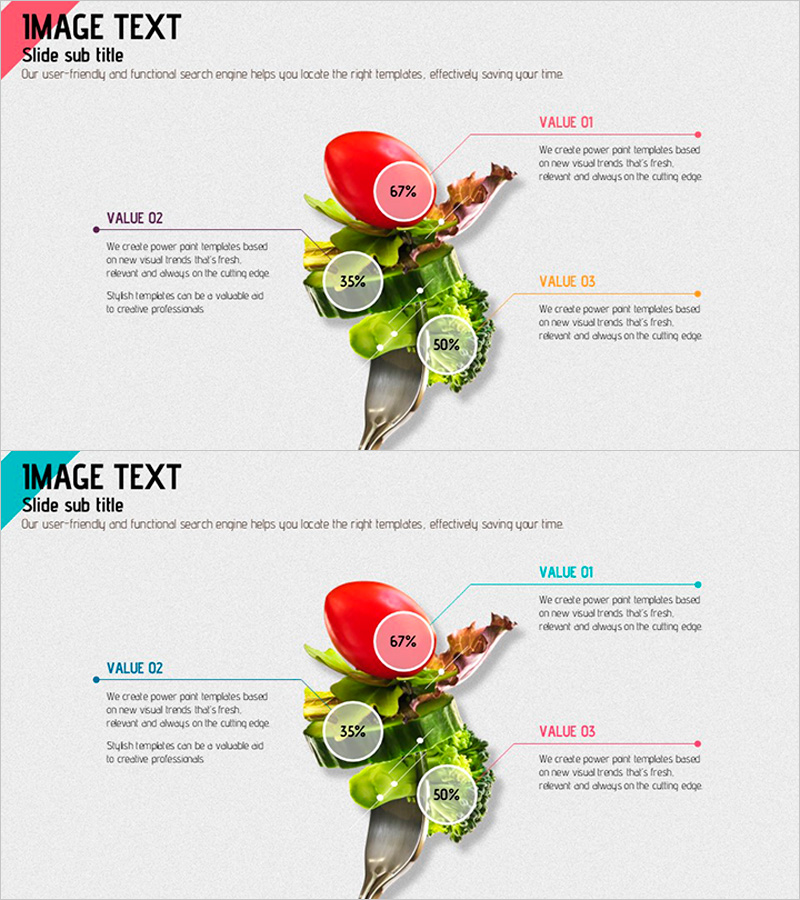
A nutritional comparison PowerPoint slide designed for health education and dietary presentations. Fresh food imagery is combined with three key nutrients visualized through circular charts and text labels for instant comparison. The composition features red, yellow, and green food items with pink, orange, and gray accent colors to convey nutritional information intuitively. The two-slide set offers multiple layout variations and is ready to use for health product marketing, nutrition consulting, wellness presentations, and diet program introductions.
Usage Points
-
Main Usage
This slide serves as a health management, dietary education, and nutrition consultation resource. It categorizes food ingredients into three key nutrients for comparative analysis and quantifies nutritional information through circular charts and percentages to support decision-making. It enables credible information delivery in wellness programs, diet consulting, and health product marketing presentations.
-
How to Use
Replace the central food image to apply the slide to various foods and products. Enter component names and descriptions in the left and right text boxes, and modify the circular chart values to reflect actual nutritional data. Use color accent lines to distinguish VALUE 01, 02, and 03 items and guide audience attention. Select one of two layout variations to match your presentation flow.
-
Recommended For
Target audiences include nutritionists, diet coaches, health food company marketing teams, hospital nutrition departments, fitness centers, wellness consultants, and food development teams. It is effective for consumer education, investor presentations, and internal training sessions where dietary information must be explained objectively and visually.
-
Slide Structure
The two-slide set features a title area at the top, central food imagery, and three text box areas on the left and right. Each area accommodates component names, descriptions, and percentage values, with circular charts and connector lines clarifying information hierarchy. The first slide emphasizes the left side while the second emphasizes the right, adapting to various presentation scenarios.
Related Products
-

Overview of Learning Activities – Efficient and Creative Presentation
#Product/Service Introduction #Diagram #Features
-

New Drug Ingredient Analysis Diagram – Conveying Trust Through Visuals
#Product/Service Introduction #Diagram #Features
-

Premium Diagram for Business Overview Visualization – Stylish Design
#Product/Service Introduction #Diagram #Features
-

Key Components and Functional Roles – Effective Cluster Diagram
#Product/Service Introduction #Diagram #Features
