New Drug Ingredient Analysis Diagram – Conveying Trust Through Visuals
RB0400016_5
- Last Update 03/12/2025
- File Size 0.3MB
- # of Slides 2
- File Format PPTX
- Slide Ratio 4:3
- Color
Keywords
About the Product
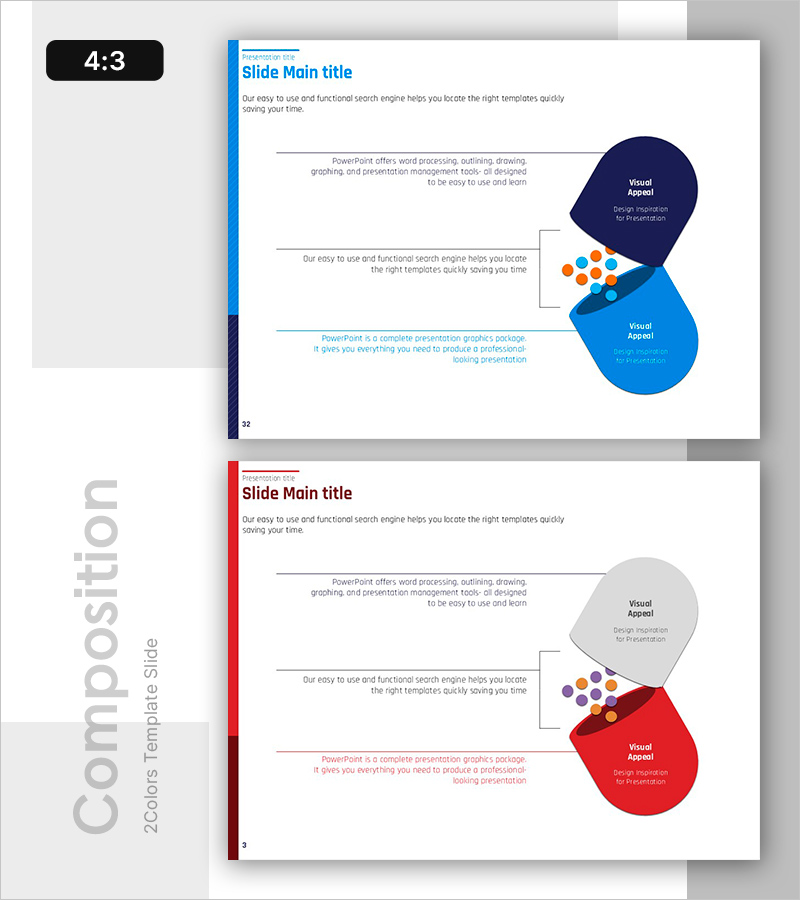
A professional overlapping cluster diagram PowerPoint slide optimized for drug ingredient analysis, product introductions, and marketing presentations. Three circular nodes in dark blue, bright blue, and red are connected to a central cluster of small elements, intuitively expressing relationships and interactions between complex components. The 2-slide set provides identical layouts in two color variations (blue and red schemes), making it immediately applicable for multiple sections or comparative analysis. Clear text input areas enable easy editing for presentation decks, product brochures, and pharmaceutical ingredient analysis materials.
Usage Points
-
Main Usage
Visualizes complex data such as drug ingredient interactions, product component relationships, and marketing positioning analysis. The structure radiates from a central core element to surrounding details, simultaneously expressing hierarchical relationships and connectivity.
-
How to Use
Enter product names, ingredient names, or functions in each circular node, and place core messages in the central elements. Use color-variant slides for comparative analysis or to represent changes over time. Adjust the number of nodes according to presentation flow and content requirements.
-
Recommended For
Pharmaceutical marketing professionals, product planning teams, technical sales representatives, and executives preparing reports benefit from this design when communicating complex data with credibility. Particularly effective for ingredient analysis, technical architecture explanation, and inter-organizational collaboration descriptions.
-
Slide Structure
2-slide set. Each slide features 3 large circular nodes (dark blue, bright blue, and red or gray and red) with a central cluster of small colored elements (orange and blue dots). Text input areas are clearly marked within each node. Formatted in 4:3 aspect ratio for optimal display on all screen sizes.
Related Products
-

Visual Infographic Slide on Tobacco Characteristics
#Product/Service Introduction #Diagram #Other
-

Galaxy Theme Brain Structure Shape Connection Diagram
#Product/Service Introduction #Diagram #Features
-

Circle Diagram for Online Shopping – Medical Business Linear Diagram
#Product/Service Introduction #Diagram #Features
-

Smart Watch Features Presentation – Innovation and Health
#Product/Service Introduction #Diagram #Features
