Future Outlook Chart for Renewable Energy Business – Market Trend Analysis
RJ0600048_9
- Last Update 07/03/2025
- File Size 1.8MB
- # of Slides 2
- File Format PPTX
- Slide Ratio 16:9
- Color
Keywords
- #Content-Based Slides
- #Design-Based Slides
- #Market and Competitor Analysis
- #Graph
- #Future Outlook
- #Industry Trends
- #Line
- #Line Chart
- #16:9
- #line chart PowerPoint
- #time-series data presentation
- #trend analysis slide
- #dual-series line graph
- #data visualization PowerPoint template
- #business chart slide design
About the Product
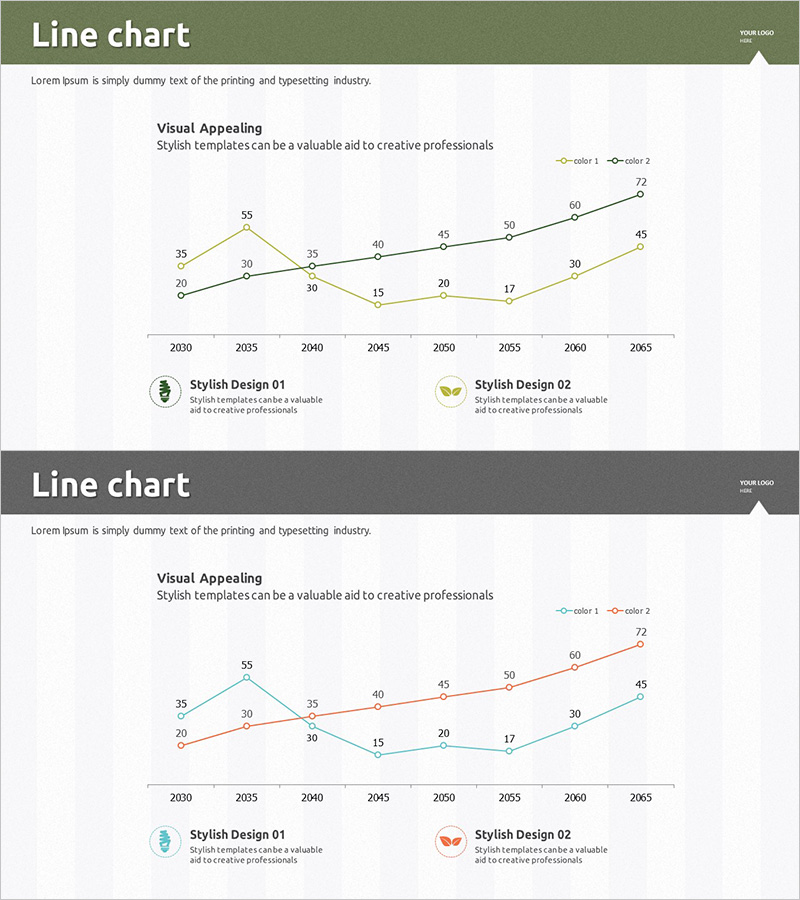
A PowerPoint slide template featuring a dual-series line chart for visualizing time-series data trends from 2030 to 2065. Each data point displays numerical values for precise information delivery, with two distinct lines enabling comparative analysis across 35 years. The design combines olive green and charcoal gray backgrounds with yellow and black line colors for strong visual contrast. Legends and icons enhance readability and professional appearance. This presentation slide is ready to use for business data visualization including market trends, revenue progression, growth rate comparisons, and performance metrics.
Usage Points
-
Main Usage
Optimized for comparing and analyzing long-term time-series data trends across multiple data series. Effectively communicates business performance indicators such as market trends, revenue progression, growth rates, and market share changes. Numerical values at each data point ensure accurate information delivery to stakeholders.
-
How to Use
Insert into financial reports, business plans, and marketing analysis documents within market analysis or performance review sections. Replace existing data by modifying the coordinate axes, line values, and numerical labels. Customize the legend and title to adapt the slide to various business contexts and presentation scenarios.
-
Recommended For
Recommended for finance teams, marketing departments, and executive presentations. Particularly effective for quarterly and annual performance analysis, market share evolution, competitive benchmarking, and return on investment trends. Ideal for consulting, financial services, energy, and manufacturing industries where data-driven decision-making is critical.
-
Slide Structure
Two-slide set. Slide 1: Olive green header background with title area, dual-series line chart (X-axis: 2030–2065, Y-axis: 0–72 range, yellow and black lines), legend, and descriptive text. Slide 2: Charcoal gray header background with identical chart structure (line colors changed to cyan and orange), two icons, and additional explanation area. 16:9 widescreen format, PPTX file type.
Related Products
-

Navigation App Market Trends and Outlook
#Market and Competitor Analysis #Graph #Future Outlook
-

Market Trends & Future Outlook Graph – An Intuitive Presentation Template
#Market and Competitor Analysis #Graph #Other
-

Current Status and Prospects of Cultivation – Market Analysis Graph
#Market and Competitor Analysis #Graph #Future Outlook
-

A Continuously Growing Broken Line Graph – Market Trends and Future Outlook
#Market and Competitor Analysis #Graph #Future Outlook
