Renewable Energy Social Contribution Activity Strategy Sprout Icon Slide
RJ0600048_13
- Last Update 07/03/2025
- File Size 2.4MB
- # of Slides 2
- File Format PPTX
- Slide Ratio 16:9
- Color
Keywords
About the Product
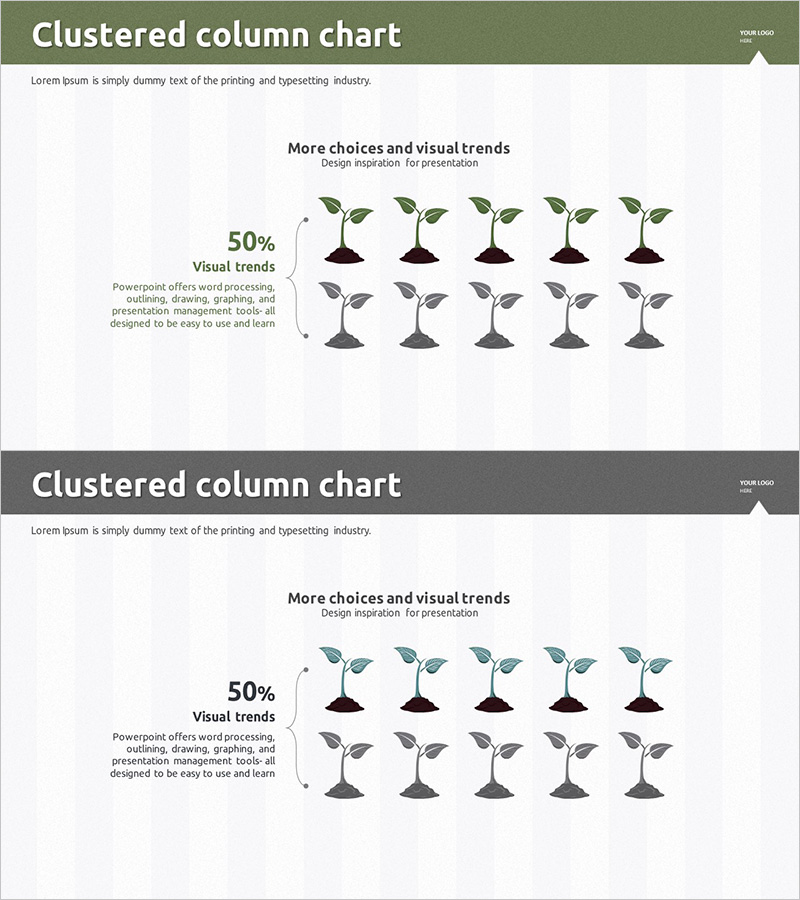
A clustered column chart PowerPoint slide designed to visualize renewable energy and social contribution activity strategies. Featuring a green-toned background with sprout icons and a two-tier data comparison structure, this slide combines a left-side text area with a right-side chart area in a balanced layout. Ideal for presenting market analysis, growth rate comparisons, and goal achievement metrics, this presentation slide is optimized for corporate sustainability strategy and environmental initiative communications. Provided in 16:9 widescreen PPTX format with fully editable elements for immediate use in professional presentations.
Usage Points
-
Main Usage
This slide visualizes two-series numerical data such as renewable energy market trends, social contribution performance, year-over-year growth rates, and goal achievement metrics. The clustered structure clearly distinguishes multiple data points per category, providing visual evidence for strategic decision-making and stakeholder communication.
-
How to Use
Enter your topic, description, and key figures in the left text area, then replace the sprout icon columns with your actual data values. The green-toned background emphasizes environmental and sustainability themes, making it highly effective for ESG reports, environmental policy presentations, and corporate social responsibility initiatives.
-
Recommended For
Renewable energy companies, environmental government agencies, sustainability executives, investor relations presentations, environmental consulting firms, corporate social responsibility program managers, and market research analysts will find this slide particularly useful.
-
Slide Structure
Two-slide set with identical layouts providing flexibility for multiple data comparisons. Each slide features a title area at the top, left-side text input space for descriptions (3-4 lines), and a right-side clustered column chart (2-tier × 5 groups). All text and chart elements are fully editable for customization.
Related Products
-

Graph Slide Visualizing Video Ratings Trends
#Market and Competitor Analysis #Graph #Other
-

Visualizing Vegetable Intake Survey Results for Males and Females
#Market and Competitor Analysis #Graph #Other
-

Graph Comparing Transportation Methods – Market Overview Analysis
#Market and Competitor Analysis #Graph #Other
-

Avocado Share Chart – Market Status and Competitive Analysis
#Market and Competitor Analysis #Graph #Other
