Connection Infographic Diagram – Business Overview and Revenue Model
RJ0600021_9
- Last Update 06/26/2025
- File Size 0.1MB
- # of Slides 2
- File Format PPTX
- Slide Ratio 16:9
- Color
Keywords
- #Content-Based Slides
- #Design-Based Slides
- #Business Introduction
- #Diagram
- #Business Overview
- #Revenue Model
- #Cluster
- #Spread
- #Chain Diagram
- #Centralized Diagram
- #16:9
- #radial diagram PowerPoint
- #4-section infographic slide
- #hub-and-spoke diagram template
- #business model presentation
- #infographic PowerPoint slide design
About the Product
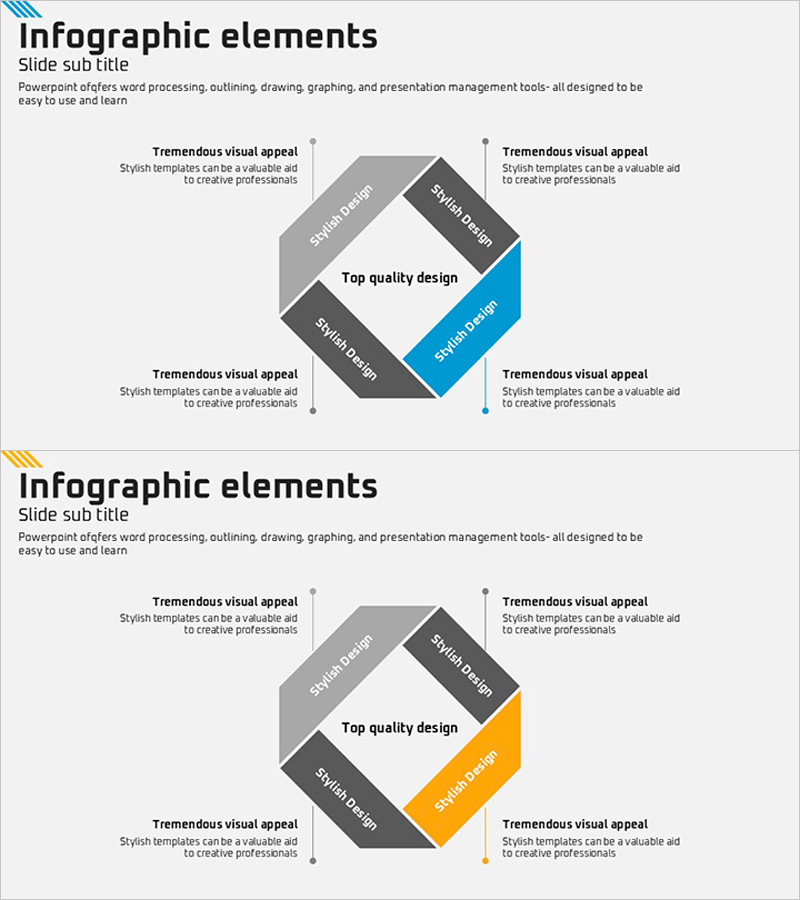
A radial infographic diagram PowerPoint slide with a central hub extending to four directional sections in gray, black, blue, and yellow. Each rotated square shape contains a text area for describing business overview, revenue model, strategy, and vision. The 2-slide set includes a color variation to accommodate multiple topics and themes. Ideal for executive presentations, business plans, and strategic reports where complex relationships and hierarchical structures need clear visual communication.
Usage Points
-
Main Usage
Visualizes organizational core values, business structure, and revenue models by extending from a central point to four directions, making relationships and hierarchies immediately clear. Effectively communicates complex business models in executive briefings, investor presentations, and strategic planning sessions.
-
How to Use
Enter core message, company name, or strategic objective in the central text area. Fill the four surrounding sections with detailed content such as business domains, revenue streams, competitive advantages, and vision. Use the two color variations to create multiple diagrams for different topics within the same presentation.
-
Recommended For
Executives, business strategists, marketing professionals, and consultants presenting business strategy, organizational structure, and revenue models. Highly effective in business plans, investor pitch decks, executive reports, and strategic planning documents.
-
Slide Structure
Central hub with four directional rotated square shapes extending outward (top, bottom, left, right), each containing a text input area. Two color schemes provided: Scheme 1 (gray, black, blue, yellow) and Scheme 2 (gray, black, yellow, orange).
Related Products
-

4-Part Revenue Components Analysis – Core of Business Structure
#Business Introduction #Technical Approach #Diagram
-

Traffic Accident Analysis Diagram – Risk Management Strategy
#Business Introduction #Risk Management and Regulatory Compliance #Diagram
-

Detailed Plan Diffusion Diagram – Business Strategy and Direction
#Business Introduction #Business Vision and Strategy #Diagram
-

Construction Illustration Diffusion Connection Diagram – Effective Business Structure Visualization
#Business Introduction #Diagram #Business Areas
