Two Types of Pie Charts – Harmonizing Design and Data
RJ0600046_8
- Last Update 07/03/2025
- File Size 0.3MB
- # of Slides 2
- File Format PPTX
- Slide Ratio 16:9
- Color
Keywords
About the Product
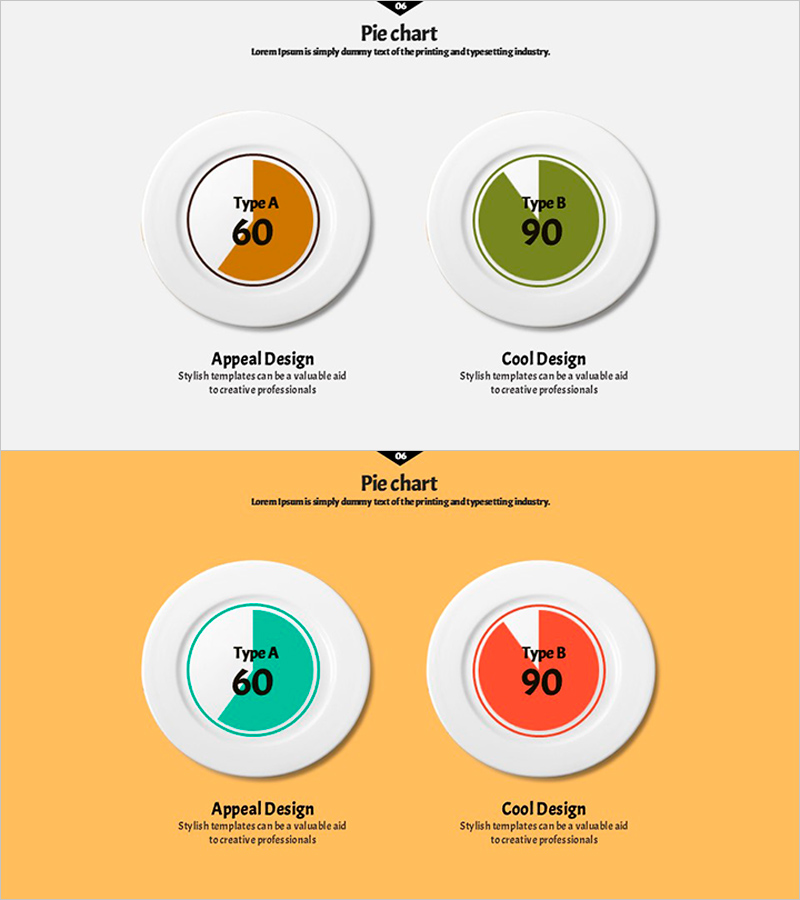
A 2-slide PowerPoint presentation featuring pie charts with dual design approaches. The same data is visualized in two distinct styles: Appeal Design with warm orange tones and Cool Design with olive green accents. Each slide displays numerical data at the center of the circular chart with a layered background circle for depth perception. This pie chart PowerPoint template is ready to use for business reports, data presentations, and analytical slides.
Usage Points
-
Main Usage
Visualize numerical data proportions and composition using pie chart slides. Two design styles—Appeal Design and Cool Design—allow you to select colors that match your presentation theme and audience. Ideal for financial reports, market analysis, performance reviews, and budget allocation explanations.
-
How to Use
Edit the pie chart values and labels with your own data. Use the orange-toned slide for energetic presentations and the olive green slide for formal business reports. Optimized for 16:9 widescreen format and fully editable in all PowerPoint versions (PPTX format).
-
Recommended For
Marketing professionals, financial analysts, project managers, sales executives, and data-driven presenters. Suitable for quarterly performance reports, budget distribution presentations, customer demographic analysis, market share comparisons, and business intelligence communications.
-
Slide Structure
2-slide layout with title area, centered circular pie chart (Type A and Type B), numerical data display within the chart, and descriptive text section at the bottom. Layered background circles add depth while clear color differentiation ensures data readability.
Related Products
-

Analysis of Major Sales Segments – Visualizing Performance with Bar Chart Template
#Business Strategy #Graph #Achievements
-

User Analysis Graph by Age Group – Advanced Data Insights
#Market and Competitor Analysis #Diagram #Graph
-

Main Business Analysis Graph – Performance Insights
#Company Introduction #Business Introduction #Diagram
-

Trend of Market Share by Suit Product – Effective Graph for Market Analysis
#Market and Competitor Analysis #Graph #Market Analysis
