Analysis Table for Ingredients
RJ0600046_5
- Last Update 07/03/2025
- File Size 0.6MB
- # of Slides 2
- File Format PPTX
- Slide Ratio 16:9
- Color
Keywords
- #Content-Based Slides
- #Design-Based Slides
- #Product/Service Introduction
- #Technical Approach
- #Diagram
- #Product and Service Overview
- #Research and Development
- #Cluster
- #Table
- #Chain Diagram
- #Standard Table
- #16:9
- #ingredient analysis table
- #table diagram PowerPoint
- #food analysis slide template
- #data comparison table
- #ingredient information PowerPoint slide
About the Product
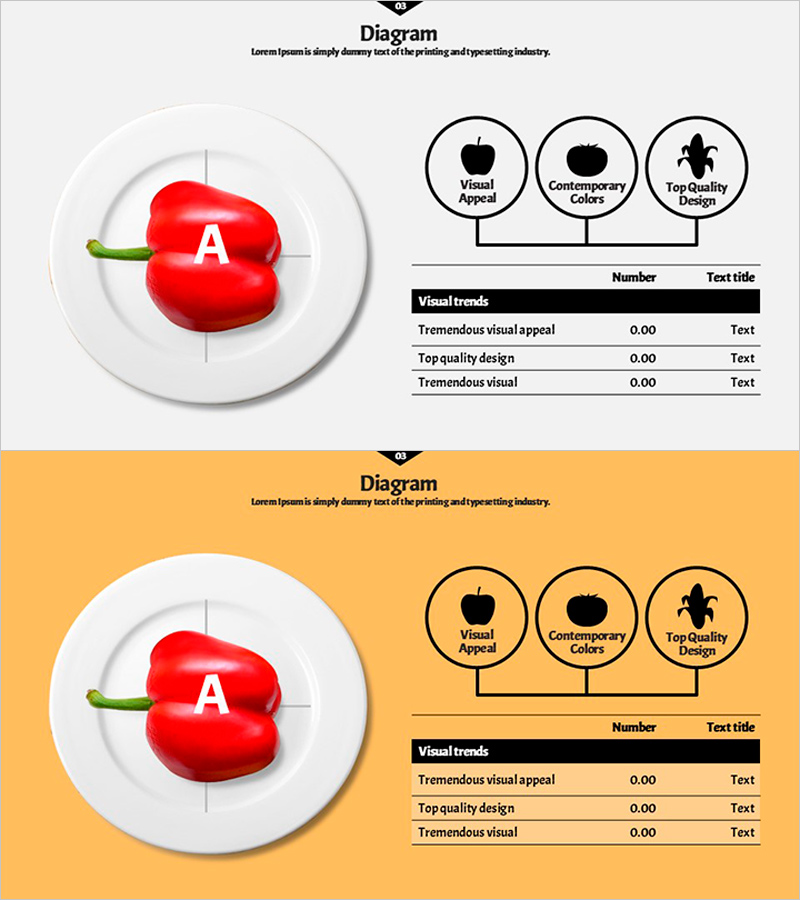
A table-based PowerPoint slide set designed for ingredient analysis and food product presentations. The slide features a hierarchical structure connecting three circular nodes at the top (Visual Appeal, Contemporary Colors, Top Quality Design) with a data table below, enabling simultaneous display of visual characteristics and numerical information about ingredients. The high-contrast design with gray background and black table maximizes information readability, while the red bell pepper image creates strong visual impact. Comprising 2 slides, this PowerPoint template is ready for immediate use in food, culinary, and nutrition-related presentations.
Usage Points
-
Main Usage
Integrates visual characteristics of ingredients (Visual Appeal, colors, design) with numerical data to clearly communicate food analysis information. The hierarchical connection between top circular nodes and bottom table strengthens logical information flow.
-
How to Use
Use as an ingredient analysis slide in food, culinary, and nutrition presentations. Input analysis item names in top nodes and numerical data or descriptions in the bottom table to systematically organize food information. Insert various ingredient photos in the image area to enhance visual variety.
-
Recommended For
Ideal for food companies, culinary educators, nutritionists, chefs, and food marketing professionals presenting ingredient analysis, comparison, and introduction materials. Suitable for product brochures, educational materials, nutrition information presentations, and food catalog creation.
-
Slide Structure
2-slide composition. Each slide is divided into left image area (for ingredient photo insertion) and right information area. Top right features 3 circular nodes (for item name input), center has connecting lines, and bottom contains 3-row table (Visual trends, numerical values, descriptions) clearly expressing information hierarchy.
Related Products
-

Blue Pink Circle Graph & Table Chart – Slide Highlighting Visual Appeal
#Product/Service Introduction #Operational Plan #Technical Approach
-

Diffusion Diagram of the Facility System
#Technical Approach #Diagram #Service Components
-

Trend and Status Analysis Slide – Blue Orange Diagram
#Business Management #Technical Approach #Diagram
-

Product Key Points Introduction Slide – Communicating Brand Identity
#Product/Service Introduction #Diagram #Features
