Website Analysis Configuration Contents – Diagram and Cluster Explanation
RJ0400041_13
- Last Update 05/28/2025
- File Size 0.2MB
- # of Slides 2
- File Format PPTX
- Slide Ratio 16:9
- Color
Keywords
- #Content-Based Slides
- #Design-Based Slides
- #Product/Service Introduction
- #Diagram
- #Composition
- #Product and Service Overview
- #Cluster
- #Chain Diagram
- #16:9
- #website analysis diagram
- #cluster diagram PowerPoint
- #connection structure slide
- #web analytics presentation
- #marketing analysis diagram PPT
- #how to create cluster diagram in PowerPoint
About the Product
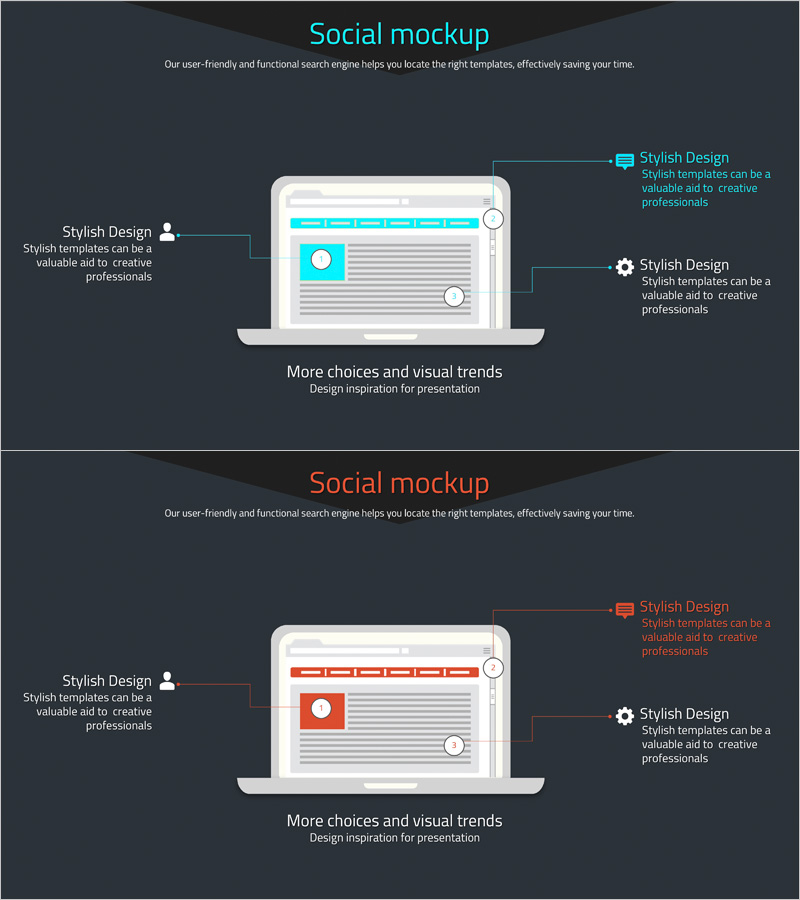
A 3-node cluster diagram PowerPoint slide designed to visually organize website analysis results. The diagram features a central hub element with left and right nodes connected by lines, clearly expressing relationships and hierarchical structure. Set against a dark gray background with cyan accent nodes and white text areas, this slide ensures high information readability. Perfect for web analytics, marketing strategy, and digital marketing presentations to effectively communicate data structures and insights. Delivered as a 2-slide PPTX file in 16:9 widescreen format, fully editable and ready to use.
Usage Points
-
Main Usage
Visually organize and present website analysis results, digital marketing insights, and data structures using a cluster diagram. The central hub with left and right node connections enables audiences to instantly grasp information relationships and hierarchical structure.
-
How to Use
Use in web analytics reports, marketing strategy presentations, and digital marketing planning documents to structure analysis findings and insights for stakeholder communication. Edit text in each node area to input analysis items, data, and conclusions, and adjust colors to control emphasis levels.
-
Recommended For
Marketing professionals, data analysts, web strategists, and digital marketing teams who need to organize analysis results structurally and communicate them persuasively to executives and clients. Especially suitable for presentations requiring clear relationships between multiple elements.
-
Slide Structure
2-slide set featuring a cyan-accented 3-node cluster diagram on the first slide and an orange-accented version on the second. Each node contains editable text areas (circular or rectangular), connected by lines extending from the center to left and right positions, expressing hierarchical relationships.
Related Products
-

Premium Watch Detailed Description Slide
#Product/Service Introduction #Diagram #Composition
-

Mobile Service Configuration Introduction – Visualized with Cluster Format
#Product/Service Introduction #Diagram #Other
-

Airplane Composition Diagram – A New Benchmark for Data Analysis
#Product/Service Introduction #Diagram #Composition
-

4-Step Method for Ingredient Management – Effective Diagram Presentation
#Product/Service Introduction #Diagram #Product/Service Introduction
