Text Box Against Orange Background
RJ0600046_19
- Last Update 07/03/2025
- File Size 4.5MB
- # of Slides 2
- File Format PPTX
- Slide Ratio 16:9
- Color
Keywords
About the Product
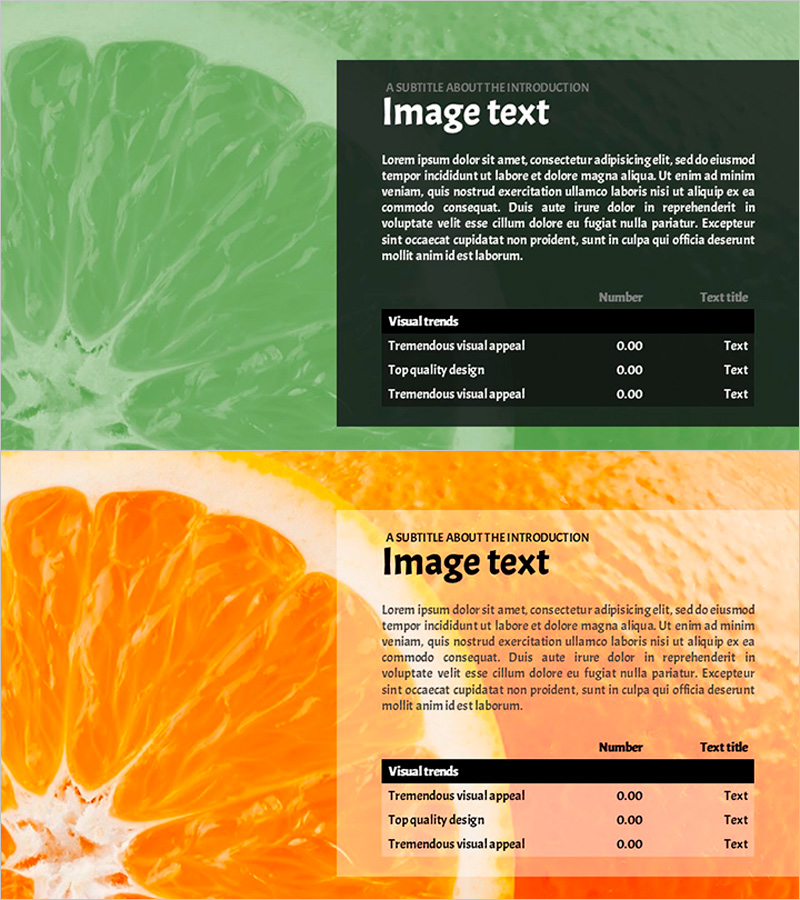
A text box PowerPoint slide featuring orange and green two-tone backgrounds across 2 slides. The layout divides each slide into an image area on the left and a content section on the right with title, body text, and data table spaces. Dark background text boxes emphasize key information and improve readability. This presentation slide template is ready to use for company introductions, product descriptions, market analysis, and business reports.
Usage Points
-
Main Usage
This slide template balances images and text to communicate information clearly. Dark background text boxes highlight key content, separating titles, descriptions, and numerical data for improved readability. Ideal for company profiles, product presentations, business updates, and data-driven content delivery.
-
How to Use
Insert product photos, charts, or diagrams in the left image area. Add titles, descriptions, and data in the right text boxes. The dark background automatically emphasizes text content, drawing audience attention during presentations. Colors and fonts can be customized to match your corporate branding.
-
Recommended For
Marketing professionals, sales presentations, product launches, business reports, and market analysis. Suitable for investor meetings, client pitches, and internal briefings. The natural orange and green color scheme conveys both professionalism and energy, making it effective for business-focused presentations.
-
Slide Structure
2-slide template with each slide divided into left image area (40%) and right text area (60%). The text section features a dark background box containing title space (1 line), body text (3-4 lines), and data table or bullet points (3 rows). Optimized for 16:9 widescreen format for modern presentation environments.
Related Products
-

Usage Analysis Graph – Visualizing Market Status
#Market and Competitor Analysis #Diagram #Graph
-

Global Network Market Analysis Table – Visualization of Data and Performance
#Business Strategy #Market and Competitor Analysis #Diagram
-

Graph Charts for Systematic Market Analysis – Bar and Pie Charts
#Technical Approach #Market and Competitor Analysis #Diagram
-

Big Data Market Analysis Graph – Trends and Performance
#Market and Competitor Analysis #Financial Plans and Performance #Diagram
