Visualizing Fire Occurrence Frequency with Line Chart
RJ0600044_9
- Last Update 07/02/2025
- File Size 6.9MB
- # of Slides 2
- File Format PPTX
- Slide Ratio 16:9
- Color
Keywords
About the Product
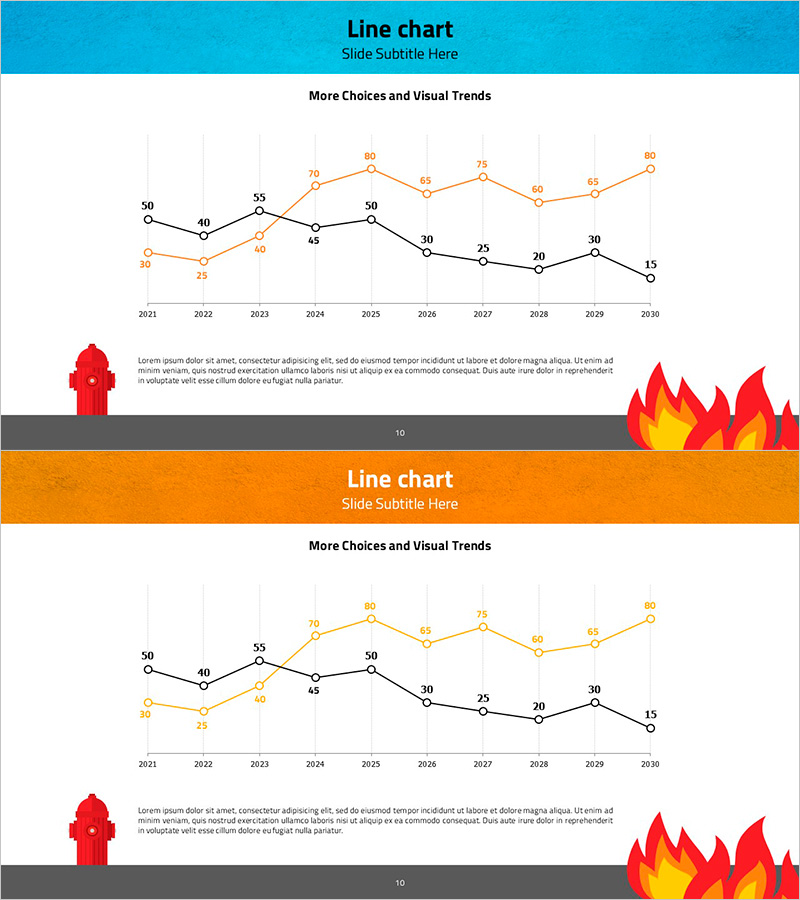
A professional line chart PowerPoint slide comparing three data series across a 10-year period from 2021 to 2030. The slide features three distinct lines in orange, black, and gray, each representing a separate data trend, with a grid background for easy value reading. Ideal for visualizing fire occurrence frequency, market share, sales volume, or any time-series data requiring multi-line comparison. The design includes a turquoise header section and orange footer area for consistent branding throughout your presentation. This 2-slide template is ready to download and edit immediately for business reports, market analysis, and performance presentations.
Usage Points
-
Main Usage
Visualize and compare multiple data trends over time to help audiences understand growth patterns, market shifts, and performance changes across different categories or departments simultaneously. The three-line format makes it easy to identify correlations and divergences between datasets.
-
How to Use
Insert your data into the chart by editing the values on the X-axis (years 2021-2030) and Y-axis (numeric scale 0-80). Customize the line colors if needed, update the title and subtitle in the turquoise header, and add your analysis text in the orange footer section. Both slides share the same layout for consistency.
-
Recommended For
Executive reports, marketing presentations on sales trends, financial performance reviews, research data analysis, consultant presentations on market dynamics, and any business context requiring multi-line trend comparison. Particularly effective for departments comparing quarterly or annual performance across multiple metrics.
-
Slide Structure
Turquoise header section (title and subtitle input area), central chart area with X-axis labeled 2021-2030, Y-axis with numeric scale 0-80, three colored lines on grid background, and orange footer section for descriptive text. Both slides maintain identical layout structure.
Related Products
-

Curve Chart of Architectural Topics
#Market and Competitor Analysis #Graph #Competitor Analysis
-

Business Strategy Analysis with Line Chart
#Business Strategy #Market and Competitor Analysis #Diagram
-

Car Wide Template Line Chart – Market and Competitive Analysis
#Business Introduction #Market and Competitor Analysis #Graph
-

Trend Color Wide Template Line Chart – Market Trend Analysis
#Market and Competitor Analysis #Graph #Future Outlook
