Arctic Business Area Line Graph Blue Green
RJ0600040_18
- Last Update 07/01/2025
- File Size 0.2MB
- # of Slides 2
- File Format PPTX
- Slide Ratio 16:9
- Color
Keywords
About the Product
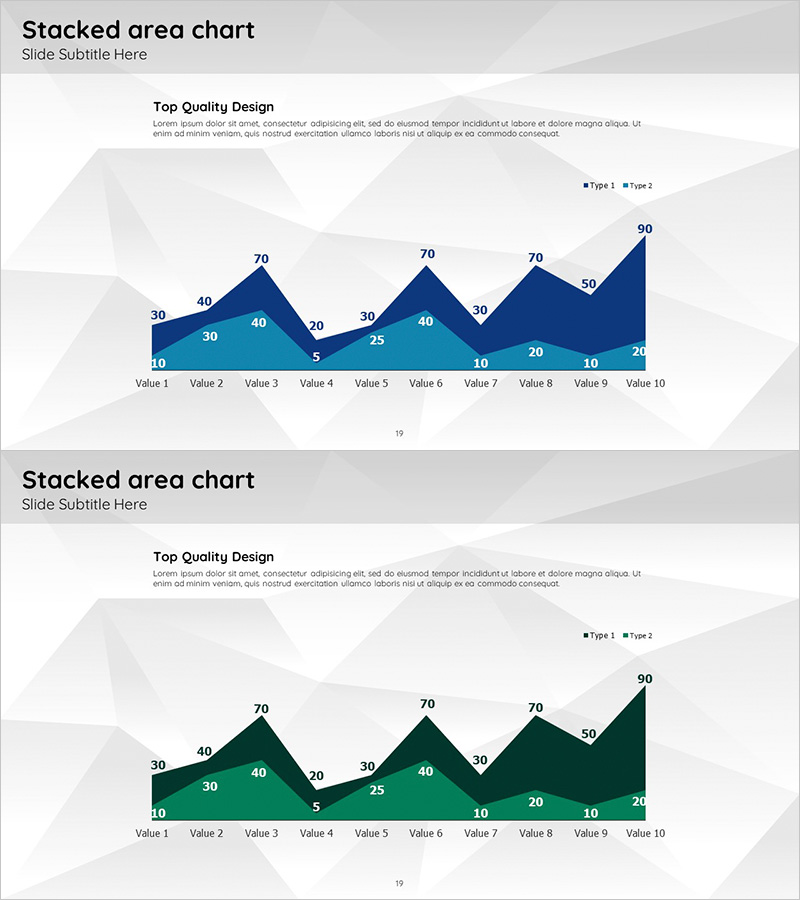
A professional stacked area chart PowerPoint slide designed for market analysis and competitive comparison presentations. This template visualizes two data series across 10 time periods using blue and green color differentiation, allowing simultaneous tracking of cumulative trends and individual series performance. The gray geometric background pattern creates a corporate aesthetic, while explicit data labels at each point ensure precise information delivery. The 2-slide set offers multiple color variations and is fully editable in PPTX format with 16:9 widescreen compatibility.
Usage Points
-
Main Usage
Illustrate market share evolution, compare performance across competitors, and visualize cumulative data trends over time. This chart type effectively demonstrates how multiple data series contribute to total values while showing individual series progression, making it ideal for market trend analysis and business performance comparisons.
-
How to Use
Insert into investor presentations, business plans, or marketing strategy documents within the market analysis section to explain competitive positioning and market share dynamics. Replace data values with your actual figures, update titles and legend labels, and the slide is ready for immediate use. Particularly effective when highlighting specific time-period totals or individual series contributions during presentations.
-
Recommended For
Executive briefings, investor pitch decks, marketing team market analysis meetings, and business performance review documents. Especially suitable for comparing revenue trends across multiple business units or product lines, or demonstrating market share changes relative to competitors.
-
Slide Structure
Comprises title area, subtitle text field, dual-series legend (Type 1 and Type 2), and a stacked area chart with 10 labeled data points. Each value is explicitly marked for accurate numerical communication, and the geometric background pattern adds visual depth and professionalism.
Related Products
-

Customer Type Analysis Slide – Focusing on Market Share
#Market and Competitor Analysis #Graph #Other
-

Market Share Donut Pie Chart & Silhouette – Unique Design and Information Delivery
#Market and Competitor Analysis #Graph #Other
-

Target Market Map for the US Space Industry – Market Analysis Slide
#Market and Competitor Analysis #Graph #Other
-

Country-by-country Regional Distribution Graph – Market Share Analysis
#Market and Competitor Analysis #Graph #Other
