Commodity Distribution System Diagram – Visualizing Efficient Distribution Flow
RJ0600038_5
- Last Update 07/01/2025
- File Size 0.2MB
- # of Slides 2
- File Format PPTX
- Slide Ratio 16:9
- Color
Keywords
About the Product
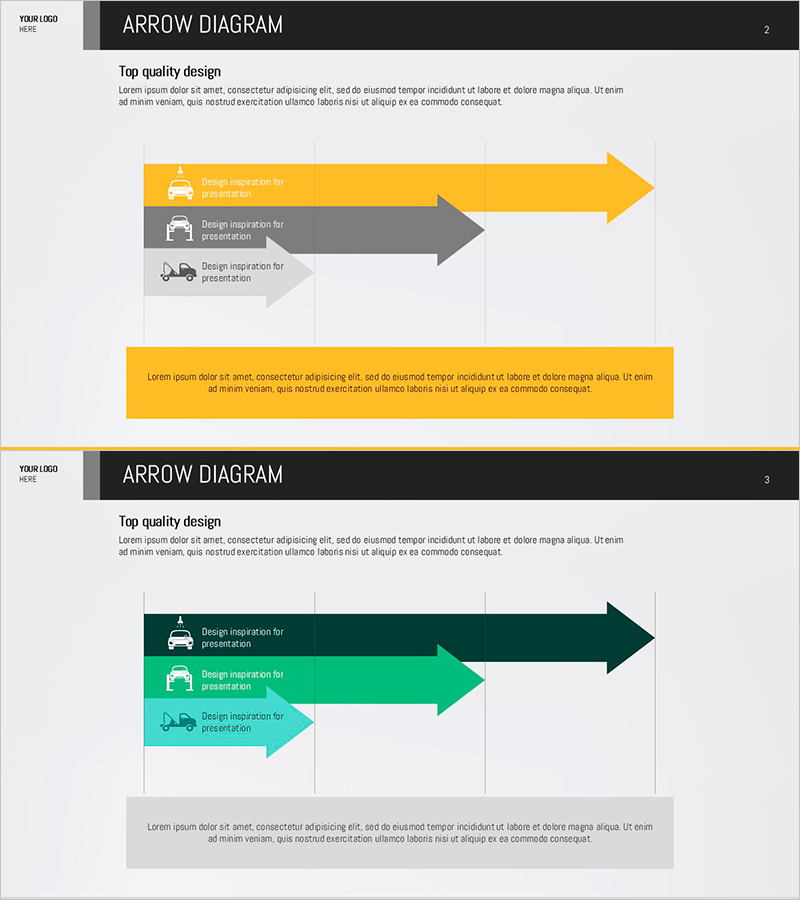
A three-stage arrow flow diagram PowerPoint slide that progresses from left to right, clearly representing sequential processes. The slide features gold, gray, and light gray color schemes with icons and text input areas at each stage. This presentation template is ready to use for distribution systems, supply chain management, business processes, and any flow-based presentations. Provided in 16:9 widescreen PPTX format with fully editable colors and text fields for customization.
Usage Points
-
Main Usage
Visualizes sequential processes in three clear stages flowing left to right. Ideal for illustrating distribution systems, supply chain workflows, business processes, product development phases, marketing funnels, and any presentation requiring step-by-step progression.
-
How to Use
Enter stage names and descriptions in each arrow box, and replace icons to match your content. Customize colors to match your company branding, add explanatory text to the background area, and adjust the layout to fit your presentation context.
-
Recommended For
Supply chain managers, marketing planners, business analysts, project managers, and sales professionals who need to explain process flows. Suitable for business plans, proposals, marketing strategies, operational reports, and strategic presentations.
-
Slide Structure
Slide 1: Title area with 3-stage arrow flow diagram in gold, gray, and light gray tones, each stage includes icon and text input area. Slide 2: Alternative color version in dark green, mint, and light mint tones. Both slides in 16:9 widescreen ratio, fully editable PPTX format with 2 slides total.
Related Products
-

Children's Media Diagram – Infusing Creativity and Fun
#Product/Service Introduction #Diagram #Features
-

Check Pattern Template Flow Diagram – Business Strategy Steps
#Business Strategy #Diagram #Step-by-Step Schedule Plan
-

Perfect Team Personnel Profile – Slide for Major Client Introduction
#Company Introduction #Customer Success Stories #Diagram
-

IT Intra Service Business Structure Diagram
#Company Introduction #Technical Approach #Diagram
