3D Printing Product Sales Differentiation Strategy Slide
RJ0400036_16
- Last Update 05/27/2025
- File Size 0.2MB
- # of Slides 2
- File Format PPTX
- Slide Ratio 16:9
- Color
Keywords
- #Content-Based Slides
- #Design-Based Slides
- #Product/Service Introduction
- #Business Vision and Strategy
- #Diagram
- #Graph
- #Other
- #Differentiation Strategy for Products/Services
- #Business Strategy
- #Flow
- #Multidirectional Flow
- #16:9
- #multidirectional arrow diagram PowerPoint
- #arrow flowchart presentation
- #business process flow slide
- #strategy diagram template
- #PowerPoint diagram slide
- #arrow flow template download
About the Product
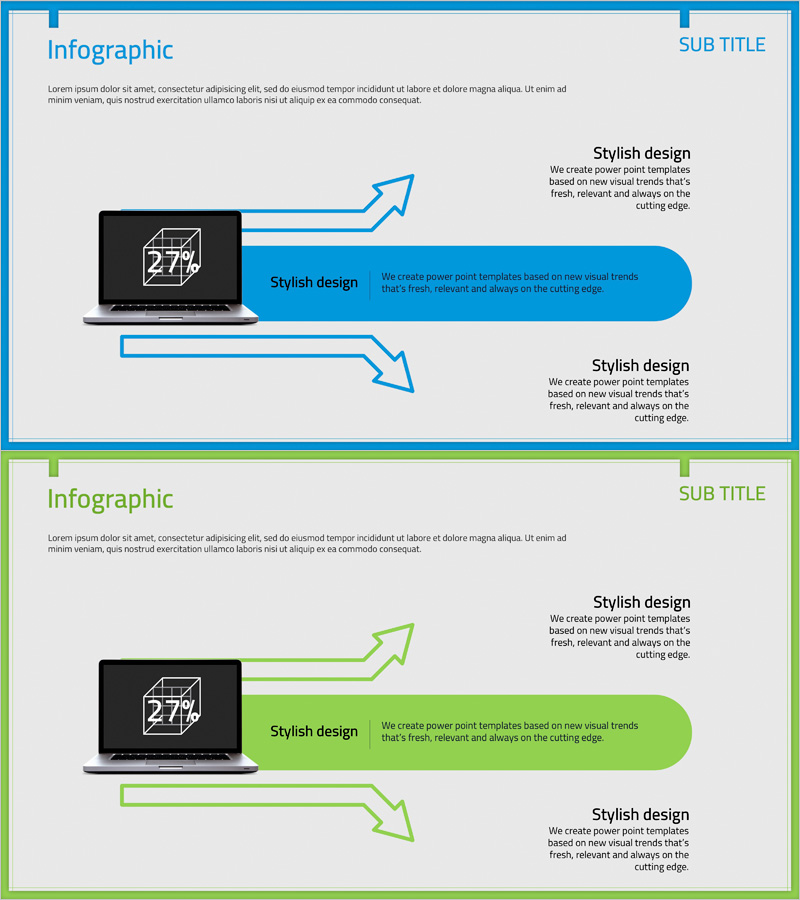
A 2-slide PowerPoint set featuring upward and downward multidirectional arrows for visualizing complex business flows. The blue and green dual-tone color scheme is ideal for product sales strategies, market entry pathways, and business processes. Each slide combines a laptop mockup image with speech bubble callouts to emphasize key messages, optimized for 16:9 widescreen format. Fully editable slides ready for corporate strategy presentations, product introductions, marketing plans, and business development pitches.
Usage Points
-
Main Usage
Visualize complex business flows, product sales pathways, and market expansion strategies using upward and downward arrows. The laptop mockup combined with speech bubble callouts effectively highlights key messages and represents multidirectional information flow.
-
How to Use
Use in corporate strategy presentations, product differentiation pitches, marketing plans, and business process explanations. Click any arrow or text box to edit colors, text, and size. Additional arrows can be inserted to customize the flow structure.
-
Recommended For
Product marketing managers, sales strategy planners, executives preparing reports, management consultants, and business development professionals explaining strategic direction, customer journeys, and market expansion plans.
-
Slide Structure
2 slides total. Blue slide: upward arrow + laptop mockup + 3 speech bubble callouts on right. Green slide: downward arrow + laptop mockup + 3 speech bubble callouts on right. Both slides in 16:9 widescreen ratio, PPTX format.
Related Products
-

Auto Industry Roadmap – Visualizing Business Strategy
#Business Vision and Strategy #Business Strategy #Diagram
-

Direction of Fintech Business Promotion – Clearly Illustrated with Linear Flow
#Product/Service Introduction #Business Strategy #Diagram
-

Sea Lighthouse Business Strategy Arrow – Toward Vision and Goals
#Product/Service Introduction #Business Vision and Strategy #Diagram
-

Business Strategy Direction Diagram – Establishing Business Vision
#Business Vision and Strategy #Marketing Plan and Strategy #Diagram
