Athlete Competency Slides – Dynamic Data Visualization
RJ0600037_29
- Last Update 06/30/2025
- File Size 0.6MB
- # of Slides 2
- File Format PPTX
- Slide Ratio 16:9
- Color
Keywords
- #Content-Based Slides
- #Design-Based Slides
- #Business Introduction
- #Market and Competitor Analysis
- #Graph
- #Other
- #Technological Status
- #Customer Analysis
- #16:9
- #athlete competency PowerPoint slide
- #stacked bar chart presentation
- #3-metric comparison slide
- #how to create a competency chart in PowerPoint
- #data visualization slides
About the Product
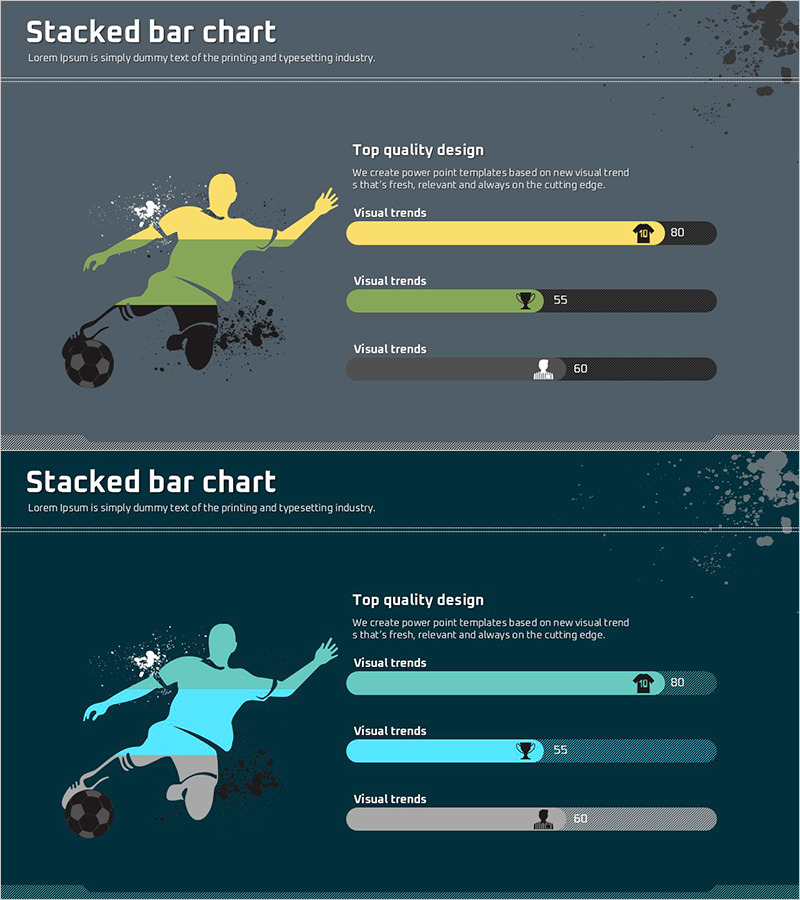
A stacked bar chart PowerPoint slide comparing athlete competencies across three metrics in a horizontal layout. The design features a left-side illustration of a dynamic athlete figure paired with a right-side data visualization area using yellow, green, and gray color segments. Each bar represents a different competency metric with labeled icons and numerical values. Fully editable text boxes and chart elements allow quick customization for presentations, business introductions, and customer analysis reports. Optimized for 16:9 widescreen format in a 2-slide set.
Usage Points
-
Main Usage
Quantifies and compares athlete, employee, or team competencies across three metrics (e.g., skill level, experience, reliability) in a single visual. Designed for sports organizations, HR departments, and consulting firms to present individual or team strengths and gaps clearly.
-
How to Use
Insert this slide in the 'Customer Analysis' or 'Business Overview' section of your presentation to benchmark competitors, team members, or athletes. Modify metric labels, icons, and numerical values directly in the editable text boxes to match your specific data and analysis context.
-
Recommended For
Sports agencies evaluating player performance, corporate HR departments presenting employee assessments, consulting firms delivering competitive analysis, and marketing teams comparing market competitors. Ideal for any presentation requiring quantitative data comparison with visual impact.
-
Slide Structure
Left side displays a dynamic athlete illustration; right side contains a 'Top Quality Design' heading followed by three stacked bar charts. Each chart includes a label, icon, and numerical score. Gray background with yellow, green, and gray bar segments creates clear visual differentiation across the three metrics.
Related Products
-

Consumer Analysis Donut & Mixed Chart – Insights into Customers
#Business Introduction #Market and Competitor Analysis #Graph
-

Idea Development Analysis Chart – Data-Driven Innovation
#Product/Service Introduction #Business Introduction #Diagram
-

Learning Content Customer Analysis Slide - Intuitive Graphs and Data Visualization
#Market and Competitor Analysis #Marketing Plan and Strategy #Graph
-

Travel Business Target Market and Customer Analysis Slide
#Market and Competitor Analysis #Graph #Other
