Soccer Game Analysis Diagram – Insights for Professionals
RJ0600037_13
- Last Update 06/30/2025
- File Size 0.6MB
- # of Slides 2
- File Format PPTX
- Slide Ratio 16:9
- Color
Keywords
About the Product
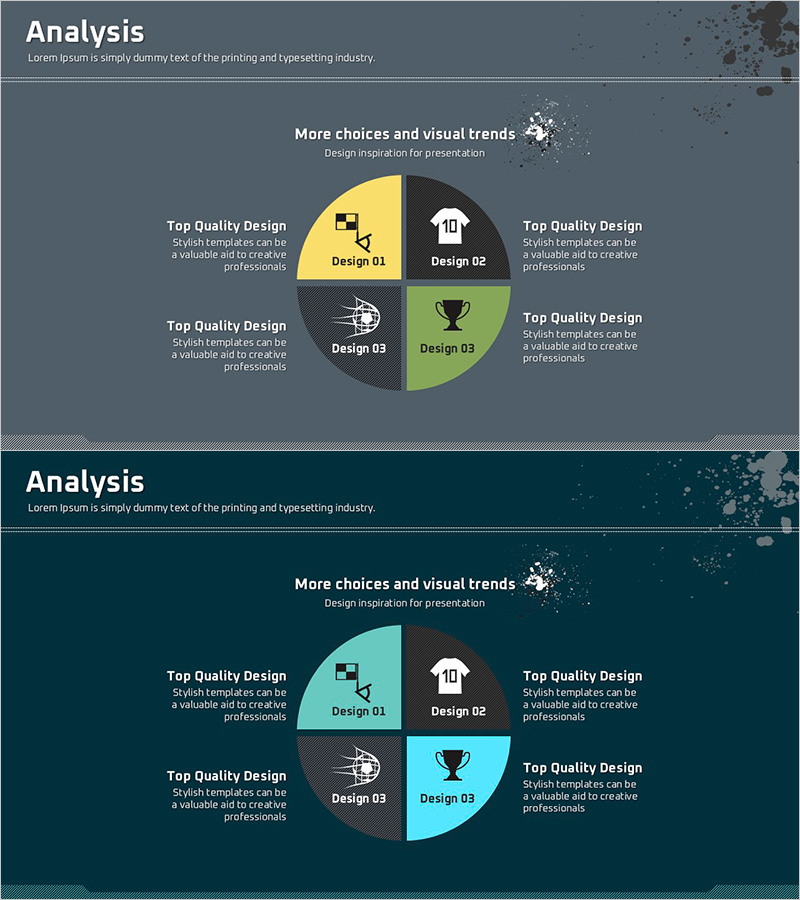
A 4-segment circular diagram PowerPoint slide designed for soccer game analysis and team performance evaluation. The pie-style diagram features four distinct color sectors (gray, yellow, green, cyan) with icons and text labels for comparing tactical approaches, team strengths, performance metrics, and improvement areas. This 16:9 widescreen 2-slide set is ready to use in sports presentations, analysis reports, and professional coaching briefings.
Usage Points
-
Main Usage
Visualize four analytical perspectives (tactical approach, team strengths, performance indicators, improvement areas) simultaneously using a circular diagram. Icons and descriptive text in each sector make complex sports data intuitive and easy to understand.
-
How to Use
Perfect for soccer game analysis presentations, team performance reports, coaching strategy meetings, and sports insights sharing. Edit sector text and icons to customize for different analysis topics and presentation contexts.
-
Recommended For
Soccer coaches, sports analysts, team managers, sports journalists, physical education instructors, and sports marketing professionals preparing game analysis materials, team evaluations, and tactical explanations.
-
Slide Structure
2-slide set with widescreen 16:9 format. Each slide features a central circular diagram divided into 4 color-coded sectors (gray, yellow, green, cyan), each with icon, title, and description text area. Side margins accommodate additional text or supporting information.
Related Products
-

Awards and Certificates Slide
#Company Introduction #Diagram #Awards and Certifications, and Patents
-

Retirement Vision Step Diagram – Visualizing Business Strategy
#Business Vision and Strategy #Diagram #Business Vision
-

Spring PowerPoint SWOT Analysis – Slide Embodying Opportunities and Threats
#Market and Competitor Analysis #Diagram #SWOT Analysis
-

Amusement Park SWOT Analysis – Attractive Design
#Market and Competitor Analysis #Diagram #SWOT Analysis
