Two-Way Bar Chart – Essence of Data Analysis
RJ0600036_11
- Last Update 06/30/2025
- File Size 0.3MB
- # of Slides 2
- File Format PPTX
- Slide Ratio 16:9
- Color
Keywords
About the Product
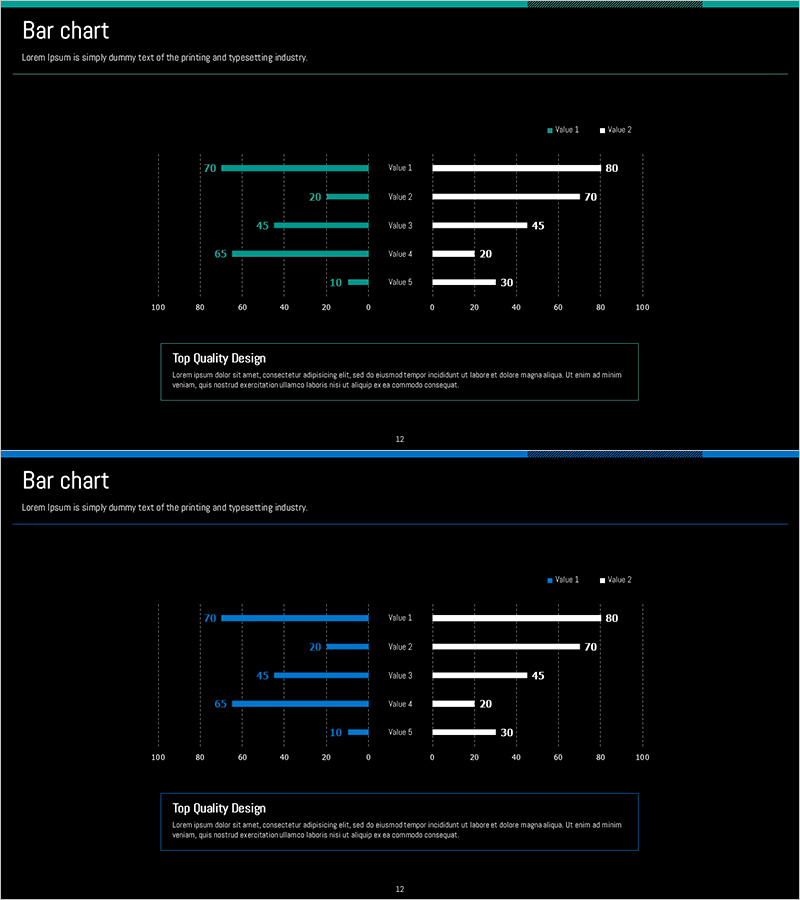
A symmetrical two-way bar chart PowerPoint slide that visualizes comparative data for five items using teal and white series. The layout extends leftward for negative values and rightward for positive values, enabling intuitive contrast analysis. Dark background with gridlines ensures easy value reading, and precise numeric labels appear on each bar. Ideal for marketing performance comparisons, regional sales contrasts, positive-negative sentiment analysis, and other dual-direction data presentations in business reports, proposals, and investor pitches.
Usage Points
-
Main Usage
Displays two data series side-by-side in a symmetrical diverging layout, making it easy to compare opposing metrics such as positive versus negative, growth versus decline, or Group A versus Group B on a single slide.
-
How to Use
Apply to business reports for performance analysis, marketing decks for competitive benchmarking, and investor materials for financial metric comparisons. Edit numeric values to input actual data and adjust series colors as needed for your presentation theme.
-
Recommended For
Finance professionals, marketing managers, data analysts, management consultants, and sales leaders presenting performance comparisons, competitive analysis, and regional performance contrasts. Effective for decision-making materials requiring quantitative evidence.
-
Slide Structure
Five items (Value 1–5) with teal bars extending left (negative direction) and white bars extending right (positive direction). Numeric labels (70, 20, 45, 65, 10) appear at bar endpoints. Background gridlines support value interpretation. Two-slide set provides layout variations.
Related Products
-

Ship Logistics Equipment Status Analysis – Facility and Market Overview
#Business Introduction #Market and Competitor Analysis #Graph
-

Competitive Advantage Donut Pie Chart (3 colors) – Frontline of Market Analysis
#Market and Competitor Analysis #Graph #Competitor Analysis
-

Idea Presentation Template Wide Bar Chart – Empowering Data Visualization
#Financial Plans and Performance #Graph #Sales and Revenue
-

Visualizing Market Overview with Area Charts and Analytical Texts – Strengthening Competitive Edge
#Market and Competitor Analysis #Graph #Other
