Business Analysis Triangle Shape Graph – Visual Market Strategy
RJ0300037_5
- Last Update 04/28/2025
- File Size 1.1MB
- # of Slides 2
- File Format PPTX
- Slide Ratio 16:9
- Color
Keywords
- #Content-Based Slides
- #Design-Based Slides
- #Company Introduction
- #Business Introduction
- #Market and Competitor Analysis
- #Diagram
- #Graph
- #Business Areas
- #Market Analysis
- #Cluster
- #Other
- #Closed Cluster Diagram
- #Other Charts
- #16:9
- #triangle chart PowerPoint
- #peak chart slide template
- #data visualization presentation
- #business analysis slide
- #market comparison PPT
- #how to create triangle graph in PowerPoint
About the Product
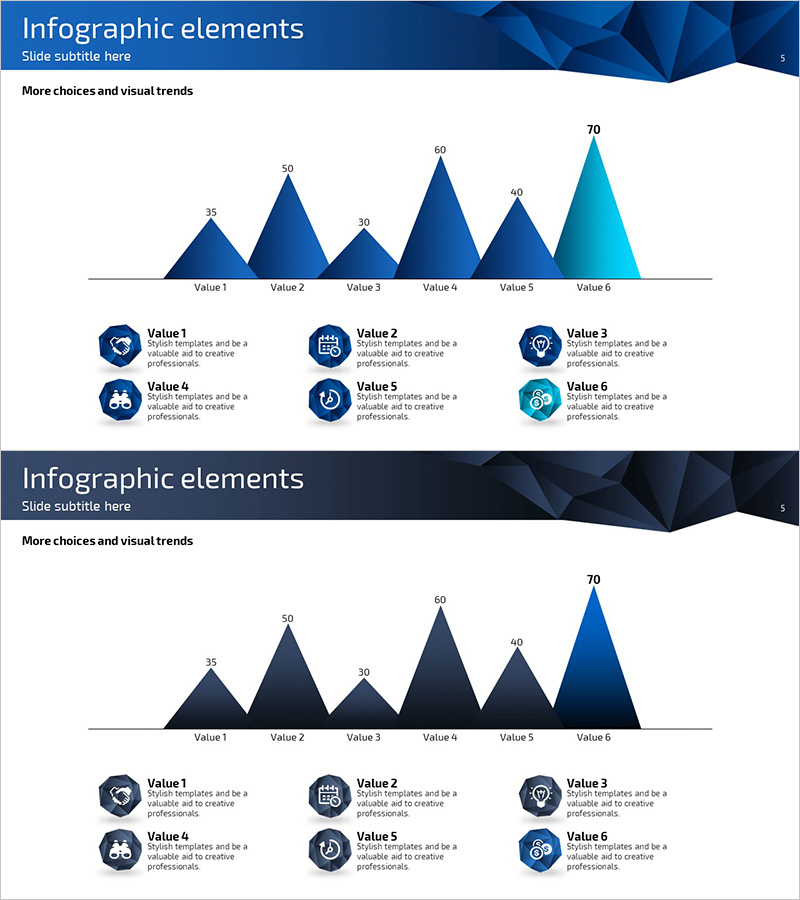
A professional triangle peak chart PowerPoint slide designed for business analysis and market strategy presentations. This data visualization template displays six data points as triangular peaks, enabling clear numerical comparison and trend analysis. The color gradient transitions from dark blue to light cyan, visually emphasizing data intensity, while each item includes an accompanying icon and text description area. Ideal for competitive analysis, market positioning, business performance comparison, and strategic planning presentations that require multi-point data visualization.
Usage Points
-
Main Usage
Visualize and compare six data points in business analysis and market strategy presentations using a triangle peak chart format. Effectively communicate competitive strengths, market positioning, business performance metrics, and multi-dimensional analysis in a single, easy-to-understand visual.
-
How to Use
Replace the numerical values (30-70) above each triangle peak with your own data. Update the six icon labels and descriptions in the bottom section with your specific items. Customize colors to match your corporate branding or maintain the default blue gradient. Adjust fonts and text sizes as needed for your presentation style.
-
Recommended For
Executive presentations, strategic planning meetings, investor pitch decks, quarterly and annual performance reports, market research findings, competitive analysis briefings, and business development presentations for management teams, marketing departments, and sales organizations.
-
Slide Structure
Two-slide set with header title area, central triangle peak chart with six data points (Value 1-6, ranging 30-70), and bottom section with six icons and text description fields. First slide features light background; second slide provides dark background version for design flexibility.
Related Products
-

Business Introduction using Vision Diagram – Effective Data Visualization
#Company Introduction #Business Introduction #Diagram
-

Automotive Maintenance Service Business Area Diagram – Effective Business Presentation
#Company Introduction #Business Introduction #Diagram
-

Medical Business Diamond Shape Diagram Slide
#Company Introduction #Business Introduction #Diagram
-

Introduction to Basic Business Functions Diagram – Effective Business Understanding
#Company Introduction #Business Introduction #Diagram
