Analysis of Key Sections – Insights on Market and Competitors
RJ0600084_15
- Last Update 07/13/2025
- File Size 0.5MB
- # of Slides 2
- File Format PPTX
- Slide Ratio 16:9
- Color
Keywords
- #Content-Based Slides
- #Design-Based Slides
- #Market and Competitor Analysis
- #Graph
- #Competitor Analysis
- #Competitive Advantage
- #Column
- #Grouped Column
- #16:9
- #clustered bar chart PowerPoint
- #market analysis slide template
- #competitor comparison chart
- #data visualization slides
- #business presentation template
About the Product
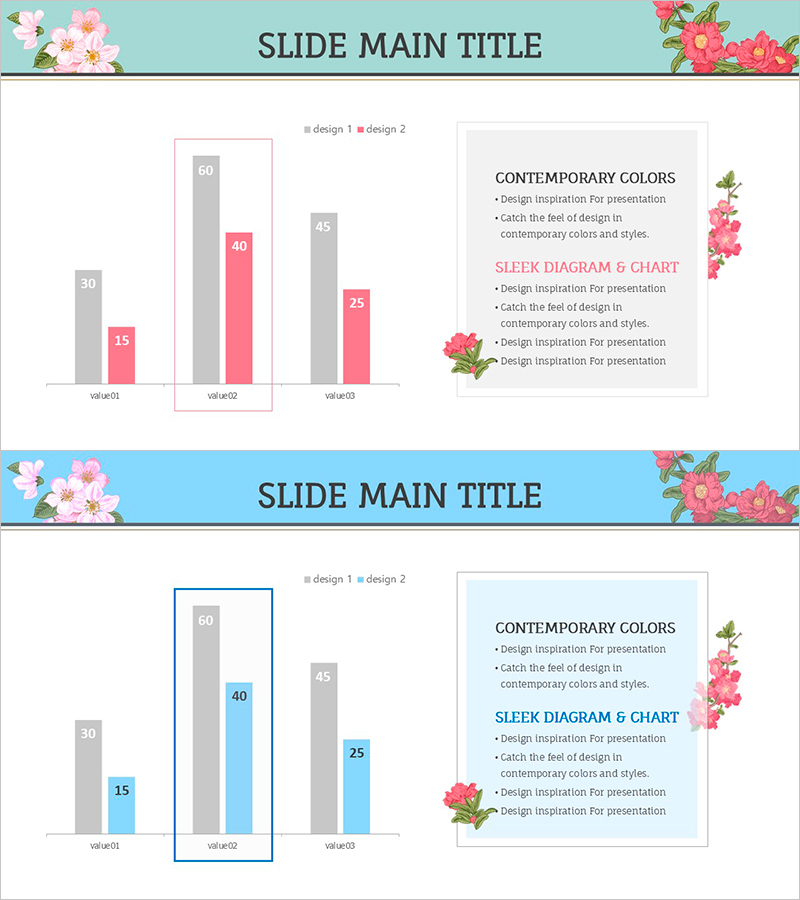
A clustered bar chart PowerPoint slide designed for market analysis and competitive insights. This 2-slide presentation template uses a gray and pink color scheme to compare three data items across two design variations simultaneously. Each bar includes numeric labels for precise data representation, making it ideal for data-driven business presentations. Provided in 16:9 widescreen PPTX format with fully editable colors and values for immediate customization.
Usage Points
-
Main Usage
Visualize and compare three data metrics across two design scenarios using clustered bar charts. Ideal for presenting market size, competitor market share, product performance benchmarks, and strategic alternatives in executive reports, investor pitches, and strategic planning meetings.
-
How to Use
Use bar height and color differentiation to highlight numerical differences. Compare gray bars (design 1) against pink bars (design 2) while presenting, or emphasize specific items among the three categories. Reference the legend and numeric labels to enhance audience comprehension and engagement.
-
Recommended For
Marketing managers, business strategists, executives, consultants, and sales leaders presenting market conditions and competitive positioning. Particularly effective for quarterly performance reviews, new business proposals, competitive advantage analysis, and market share discussions.
-
Slide Structure
2-slide set with consistent layout: title area at top, clustered bar chart in center (3 items × 2 series), and text box on right for insights. Slide 1 features gray and pink tones; Slide 2 offers gray and light blue variation for design flexibility.
Related Products
-

Eco-friendly Icon Bar Graph Slide
#Market and Competitor Analysis #Diagram #Graph
-

Market Competition: Deep Dive into Top 3 Firms
#Market and Competitor Analysis #Graph #Competitor Analysis
-

Visualize Market Analysis with Comparison Orange Bar Chart - Identify Competitive Edge
#Market and Competitor Analysis #Graph #Competitor Analysis
-

Triangular Pattern Column Chart Template – Market Competitive Advantage Analysis
#Market and Competitor Analysis #Graph #Competitor Analysis
