Tree Infographic Service Implementation Plan – Strategic Visualization
RJ0600028_31
- Last Update 06/28/2025
- File Size 4.4MB
- # of Slides 2
- File Format PPTX
- Slide Ratio 16:9
- Color
Keywords
- #Content-Based Slides
- #Design-Based Slides
- #Business Strategy
- #Technical Approach
- #Diagram
- #Production Plan
- #Future Development Roadmap
- #Flow
- #Linear Flow
- #16:9
- #tree diagram PowerPoint
- #linear flow diagram slide
- #3-step process visualization
- #service implementation plan PPT
- #nature infographic template
About the Product
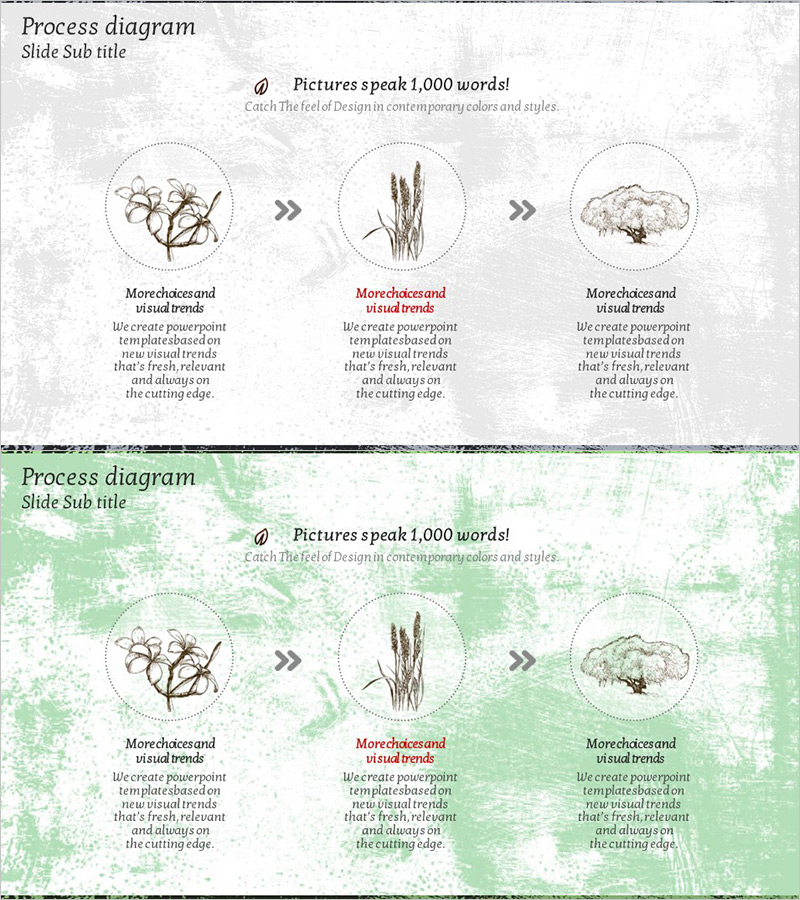
A linear tree diagram PowerPoint slide featuring three connected nodes with nature-based imagery (trees, plants, clouds) to visualize service implementation strategy, business execution phases, and vision roadmap. Available in two background color options: neutral gray and fresh green. Each stage includes dedicated text description areas for detailed explanations. Delivered in 16:9 widescreen PPTX format, fully editable and ready for consulting presentations, strategic planning decks, and business reports.
Usage Points
-
Main Usage
Communicate service adoption plans, business execution strategies, and vision implementation phases through a three-node linear flow. Nature-based imagery (trees, plants, clouds) conveys organic growth and forward momentum, while each stage provides space for detailed explanations and supporting information.
-
How to Use
Insert relevant images into the three circular nodes, then add stage-specific descriptions (objectives, implementation steps, expected outcomes) in the text areas below each node. Select either the gray or green background version based on your presentation tone and audience context.
-
Recommended For
Executives, strategy teams, management consultants, and marketing professionals presenting business plans, service launch strategies, and organizational transformation initiatives. Ideal for startup investor pitches, internal strategy meetings, and client proposal presentations.
-
Slide Structure
Two-slide set. Each slide displays three circular nodes arranged horizontally (left to right) connected by arrow symbols (»). Below each node is a title and description text field. Top section includes slide title and subtitle areas for context and messaging.
Related Products
-

Vehicle Production Plan Diagram – Business Vision and Implementation Strategy
#Business Vision and Strategy #Business Strategy #Diagram
-

Step-by-Step Construction Plan - A Visual Diagram for Business Strategy
#Business Strategy #Diagram #Production Plan
-

Presentation Slide Visually Capturing Farming Harvest Business Production and Technology Development Strategy
#Business Strategy #Technical Approach #Diagram
-

Eco-friendly Agricultural Goal Market Strategy Arrow – Direction for Business Advancement
#Business Strategy #Technical Approach #Diagram
