Environmental Strategy Diagram
RJ0600067_16
- Last Update 07/07/2025
- File Size 0.4MB
- # of Slides 2
- File Format PPTX
- Slide Ratio 16:9
- Color
Keywords
- #Content-Based Slides
- #Design-Based Slides
- #Technical Approach
- #Corporate Social Responsibility
- #Diagram
- #Future Development Roadmap
- #Environmental Protection Efforts
- #Flow
- #Cluster
- #Linear Flow
- #Closed Cluster Diagram
- #16:9
- #arrow diagram PowerPoint
- #4-step process slide
- #linear flow diagram
- #sequential process PowerPoint
- #business process diagram template
About the Product
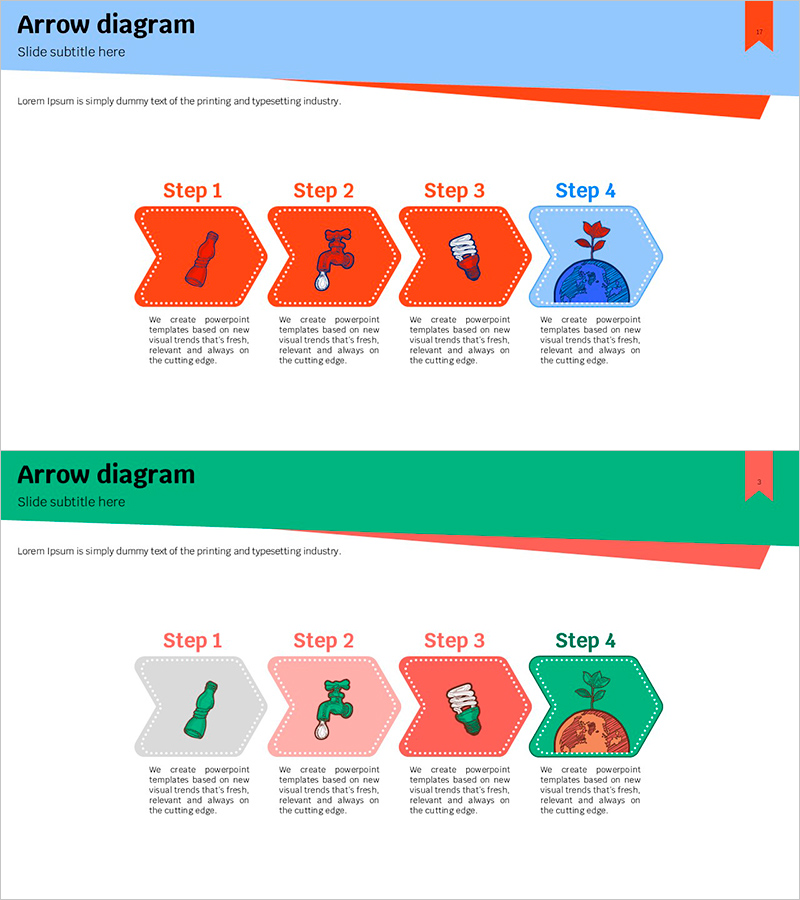
A PowerPoint slide featuring a 4-step linear process diagram with arrow-shaped elements. The design uses orange for the first three steps and blue for the final step, creating a clear visual progression. Each step includes an icon placeholder and descriptive text area, making it ideal for presenting project timelines, product development stages, environmental strategies, and business workflows. The set includes 2 slides with different background colors (light blue and green) to add variety to your presentation. Optimized for 16:9 widescreen format in fully editable PPTX file.
Usage Points
-
Main Usage
Designed to visualize sequential processes, step-by-step progression, and linear workflows. Ideal for presenting project roadmaps, product development phases, marketing campaign timelines, environmental policy implementation stages, and any 4-step or multi-step linear process that requires clear visual communication.
-
How to Use
Replace the placeholder icons and text within each arrow shape with your own content. Edit the step titles and descriptions to match your presentation topic, and adjust colors as needed to align with your brand guidelines. You can duplicate the slides to represent additional processes or workflows.
-
Recommended For
Project managers, marketing professionals, strategy planners, corporate social responsibility teams, product development teams, educators, and business consultants presenting process flows, progress reports, strategic initiatives, and workflow explanations.
-
Slide Structure
2-slide set. Each slide contains 4 arrow-shaped nodes arranged in a left-to-right linear progression. The first three nodes are orange, while the final node is highlighted in blue. Each node includes an icon placeholder area and a text description section for customization.
Related Products
-

Red Blue Strategy Diagram - Business Vision and Future Development
#Business Vision and Strategy #Technical Approach #Diagram
-

How to Enjoy Nature – Vision and Strategy
#Business Vision and Strategy #Technical Approach #Diagram
-

5-Stage Strategy for a Greener Planet
#Business Strategy #Corporate Social Responsibility #Diagram
-

Business Strategy Flow System – Innovation and Growth
#Technical Approach #Diagram #Future Development Roadmap
