Maple Leaf Key Performance Diagram – A Visually Appealing Cluster
RJ0600028_28
- Last Update 06/28/2025
- File Size 4MB
- # of Slides 2
- File Format PPTX
- Slide Ratio 16:9
- Color
Keywords
- #Content-Based Slides
- #Design-Based Slides
- #Product/Service Introduction
- #Diagram
- #Features
- #Composition
- #Cluster
- #Closed Cluster Diagram
- #16:9
- #cluster diagram PowerPoint
- #4-node circular diagram slide
- #radial layout PowerPoint template
- #key performance visualization
- #closed-form diagram template download
About the Product
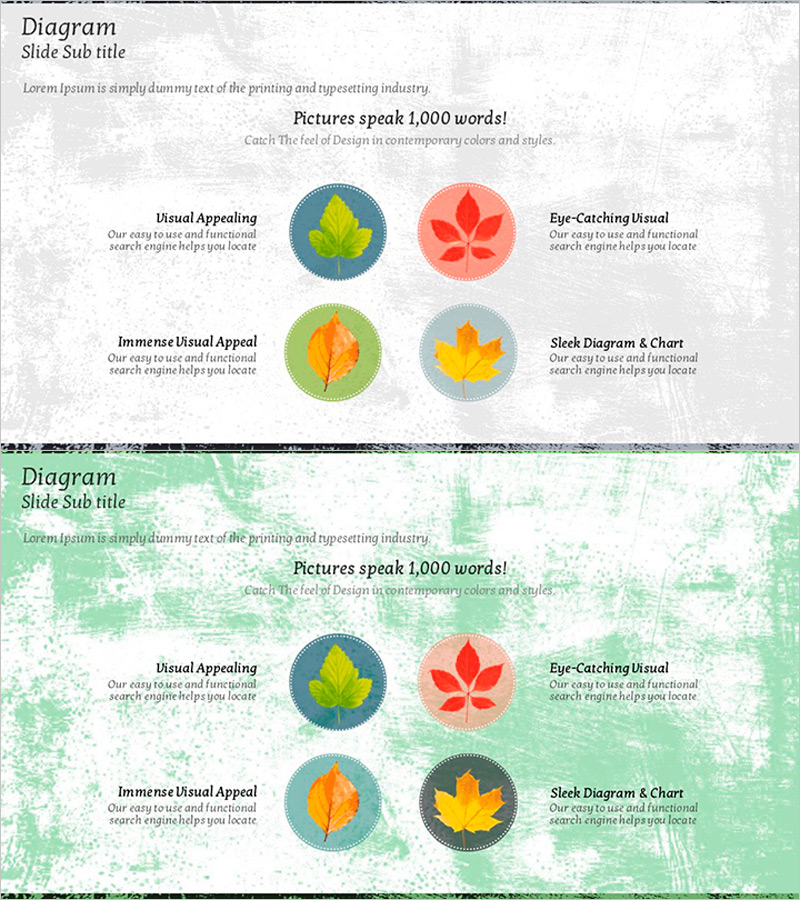
A closed-form cluster diagram PowerPoint slide featuring four maple leaf icons arranged in a circular pattern around a central core message. This symmetric layout effectively communicates key performance indicators, core values, strategic elements, or competitive advantages. The design uses five color tones—gray, blue, red, orange, and green—with circular backgrounds and yellow maple leaf illustrations for visual cohesion. Comprising 2 slides in 16:9 aspect ratio (PPTX format), this template is fully editable and ideal for presentations, business plans, proposals, and reports requiring balanced four-element visualization.
Usage Points
-
Main Usage
Designed to present four interconnected elements—such as core values, key performance metrics, strategic pillars, or competitive advantages—in a balanced, visually unified manner. The central hub emphasizes integration and mutual relationships among the four surrounding nodes.
-
How to Use
Apply to company profile sections highlighting core values, business plan strategy summaries, proposal differentiation points, or marketing plan performance overviews. Customize node text and background colors to match organizational branding and messaging requirements.
-
Recommended For
Recommended for executives, planning teams, marketing departments, and sales teams presenting strategy, performance, or organizational values. Particularly suited for corporate reports, investor presentations, strategic briefings, and any context requiring balanced four-element communication.
-
Slide Structure
2-slide set. Slide 1: Gray textured background with four circular nodes (blue, red, orange, green) arranged symmetrically around a central point, each containing a maple leaf illustration and text area. Slide 2: Identical structure with green textured background. 16:9 aspect ratio, PPTX format with all elements fully editable.
Related Products
-

Circular Text Box and Cactus on Shelf Slide
#Product/Service Introduction #Operational Plan #Diagram
-

Different Food Diagrams – Visualizing the Flavor World
#Product/Service Introduction #Diagram #Features
-

Online Shopping Mall Composition Diagram – Data Visualization
#Product/Service Introduction #Diagram #Other
-

Supplement and Diet Product Introduction Slide - Linear Flow Diagram
#Product/Service Introduction #Diagram #Features
