Online Shopping Mall Composition Diagram – Data Visualization
RJ0400057_12
- Last Update 06/02/2025
- File Size 1.4MB
- # of Slides 2
- File Format PPTX
- Slide Ratio 16:9
- Color
Keywords
- #Content-Based Slides
- #Design-Based Slides
- #Product/Service Introduction
- #Diagram
- #Other
- #Features
- #Composition
- #Cluster
- #Closed Cluster Diagram
- #16:9
- #online shopping mall diagram
- #cluster diagram PowerPoint
- #business process visualization slide
- #e-commerce system diagram PPT
- #shopping platform structure template
About the Product
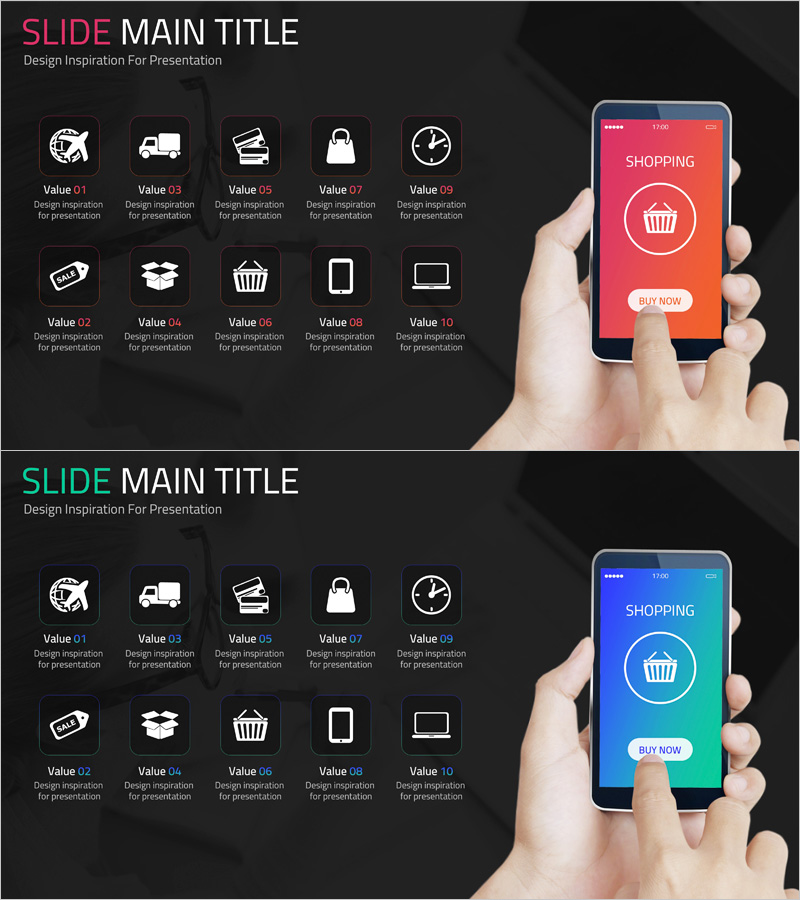
A cluster diagram PowerPoint slide visualizing the core components of an online shopping mall with 10 functional icons. The design features a central shopping mall concept with key functions—shipping, payment, products, security, and time management—radiating outward in a hub-and-spoke structure. Set against a dark background with white icons and text for strong contrast, each element is labeled clearly to represent information hierarchy. This 2-slide deck is ready for immediate use in business presentations, e-commerce strategy pitches, and service overview materials.
Usage Points
-
Main Usage
This diagram is designed to present the key functions and structural components of an e-commerce platform at a glance. It effectively communicates complex shopping mall systems in an intuitive way during mall planning, service introductions, and business model explanations.
-
How to Use
The slide features a central shopping mall icon with 10 functional elements (shipping, payment, products, security, time, pricing, distribution, shopping cart, mobile, laptop) radiating outward in a circular pattern. Each icon is connected to the center by lines. You can customize the text labels next to each icon to match your specific service features.
-
Recommended For
E-commerce managers, online marketing planners, startup founders, and IT service planning teams explaining shopping mall architecture and functionality. Suitable for investor presentations, client proposals, and internal training materials.
-
Slide Structure
2-slide deck. The first slide features a dark background (black/gray) with a central shopping mall icon surrounded by 10 functional icons arranged in a circle, each connected to the center by lines. The second slide presents a similar structure with a color variation (teal-to-blue gradient background). 16:9 widescreen format in PPTX, with all elements fully editable.
Related Products
-

Business Analysis Area Type Graph – The Core of Data Visualization
#Product/Service Introduction #Diagram #Other
-

Body Organ Disease Analysis Diagram – Clear Information Delivery
#Product/Service Introduction #Diagram #Other
-

Diagram Slide Emphasizing Business Solution Features
#Product/Service Introduction #Diagram #Other
-

Social Network Business Structure – Innovative Eco-friendly Design
#Product/Service Introduction #Diagram #Other
