Maple Leaf Differentiation Strategy Diagram
RJ0600028_20
- Last Update 06/28/2025
- File Size 4MB
- # of Slides 2
- File Format PPTX
- Slide Ratio 16:9
- Color
Keywords
- #Content-Based Slides
- #Design-Based Slides
- #Product/Service Introduction
- #Diagram
- #Differentiation Strategy for Products/Services
- #Cluster
- #Combination Diagram
- #16:9
- #Venn diagram PowerPoint
- #3-circle overlapping diagram slide
- #differentiation strategy diagram
- #business diagram PowerPoint template
- #how to create Venn diagram in PowerPoint
About the Product
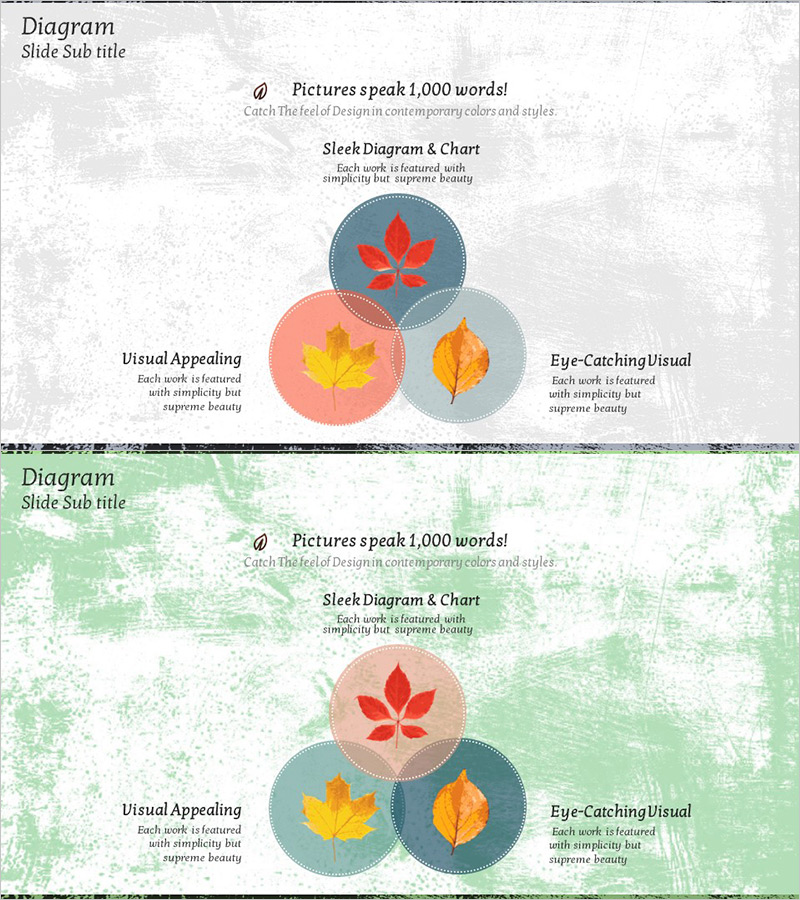
A Venn diagram PowerPoint slide featuring three overlapping circular nodes that visualize intersection relationships for strategic positioning. The design combines a dark teal circle with a red maple leaf, a coral circle with a yellow maple leaf, and a gray circle with an orange maple leaf, creating visual differentiation. Text areas surround each circle for describing strategy elements. The 2-slide set in 16:9 widescreen PPTX format is fully editable and ready for business presentations, strategy planning documents, and competitive analysis reports.
Usage Points
-
Main Usage
Visualizes the intersection of three strategic elements to illustrate competitive positioning and differentiation. Ideal for identifying the convergence point of product features, customer needs, and competitor weaknesses during strategy development. Commonly used in marketing, sales, and executive presentations.
-
How to Use
Enter strategy element names in each circular node and add detailed descriptions in the surrounding text areas. Colors and maple leaf icons can be retained or customized to match corporate branding. Duplicate the 2-slide set to compare multiple strategic scenarios side by side.
-
Recommended For
Marketing strategists, business development teams, management consultants, startup founders preparing pitch decks, and corporate strategy presenters. Applicable to differentiation strategy, competitive positioning, market segmentation, and business model analysis.
-
Slide Structure
2-slide set. Each slide contains 3 overlapping circular nodes (dark teal, coral, gray) with intersection areas and 3 text input zones positioned around each circle. Maple leaf icons are centered in each circle for visual emphasis and thematic consistency.
Related Products
-

Identity Wide Template – Overlapping Diagram Usage
#Product/Service Introduction #Diagram #Differentiation Strategy for Products/Services
-

Market Share Donut Pie Chart – The Choice for Business Success
#Product/Service Introduction #Diagram #Features
-

Cloud Service Differentiation Strategy Slide – Modern Diagrams for Business Approach
#Product/Service Introduction #Marketing Plan and Strategy #Diagram
-

Camping Infographic Nested Diagram – Emphasizing Product/Service Comparison
#Product/Service Introduction #Diagram #Features
