Blue Green Donut Chart Analysis – Visualization of Customer Success Stories
RJ0600027_29
- Last Update 06/27/2025
- File Size 0.2MB
- # of Slides 2
- File Format PPTX
- Slide Ratio 16:9
- Color
Keywords
- #Content-Based Slides
- #Design-Based Slides
- #Market and Competitor Analysis
- #Customer Success Stories
- #Graph
- #Customer Analysis
- #Customer Success Metrics
- #Circles
- #Doughnut Chart
- #16:9
- #donut chart PowerPoint
- #pie chart slide template
- #4-segment ratio analysis
- #data visualization presentation
- #customer success metrics chart
About the Product
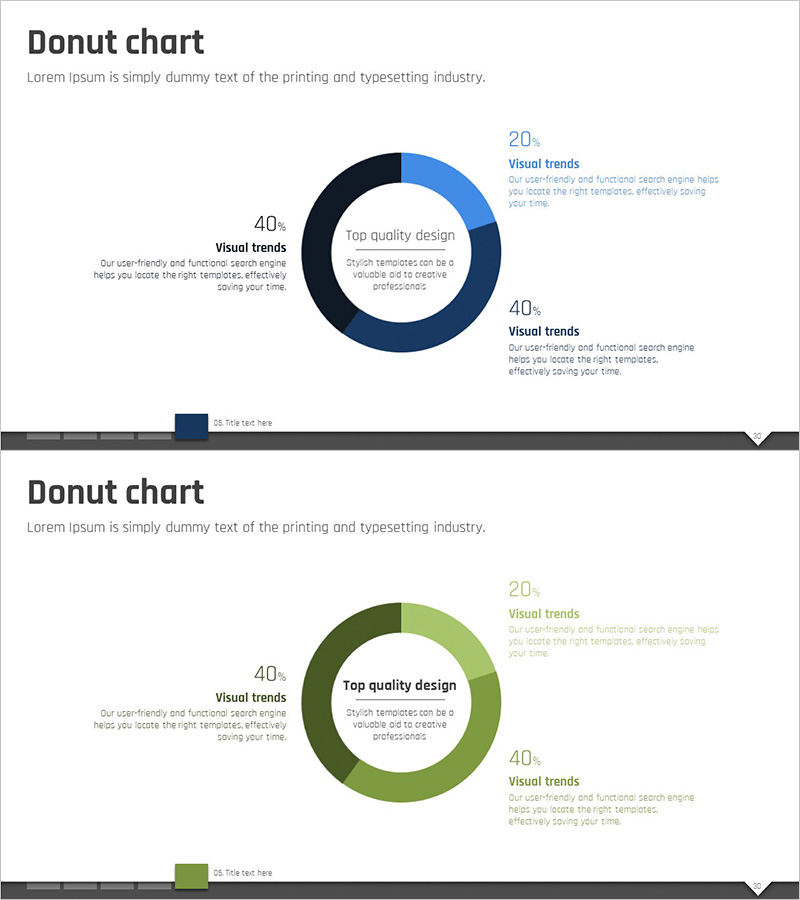
A 4-segment donut chart PowerPoint slide designed to visualize customer success stories and business performance metrics. The slide features a gradient color scheme in blue, navy, and green tones that clearly represent the proportion of each segment, with a central circular area for key messaging. The 2-slide set accommodates various data analysis scenarios and is ideal for presenting quantitative results in customer analysis, market analysis, and corporate social responsibility contexts. Fully editable in PPTX format, allowing you to input your own data immediately.
Usage Points
-
Main Usage
Optimized for visually representing quantitative data proportions and composition. Effectively communicates 4-item performance comparisons such as customer analysis, market share, corporate responsibility metrics, revenue composition, departmental contribution, and customer satisfaction distribution at a glance.
-
How to Use
Replace the numerical values and labels in each segment with your own data. Add your core message or title in the central circular area, and include descriptive text for each segment in the right text section to customize the slide for your presentation context.
-
Recommended For
Recommended for marketing, sales, and executive reports; customer success case presentations; and quarterly or annual performance analysis presentations. Ideal for executives, team leaders, and analysts who require data-driven decision-making visuals.
-
Slide Structure
2-slide set with each slide featuring a 4-segment donut chart in blue, navy, and green gradient tones, paired with a right-aligned text area. Optimized for 16:9 widescreen format in modern presentation environments, with each segment independently editable for color, values, and labels.
Related Products
-

Donut Chart for Visualizing Learning Progress
#Market and Competitor Analysis #Graph #Customer Analysis
-

Drawing Kids Donut Chart – Visualizing Customer Analysis
#Market and Competitor Analysis #Graph #Customer Analysis
-

Customer Share Pie Chart – Attractive Customer Analysis
#Product/Service Introduction #Market and Competitor Analysis #Graph
-

Frustration and Leap Donut Chart
#Market and Competitor Analysis #Graph #Customer Analysis
