Service and System Operation Plan Arrow Diagram
RJ0600027_27
- Last Update 10/06/2025
- File Size 0.2MB
- # of Slides 2
- File Format PPTX
- Slide Ratio 16:9
- Color
Keywords
- #Content-Based Slides
- #Design-Based Slides
- #Technical Approach
- #Diagram
- #Service Operation Plan
- #Service Implementation Plan
- #Spread
- #Radial Diagram
- #16:9
- #radial diagram PowerPoint
- #service operation flow slide
- #expansion diagram template
- #3-step process diagram
- #business process PowerPoint slide
- #how to create radial diagram in PowerPoint
About the Product
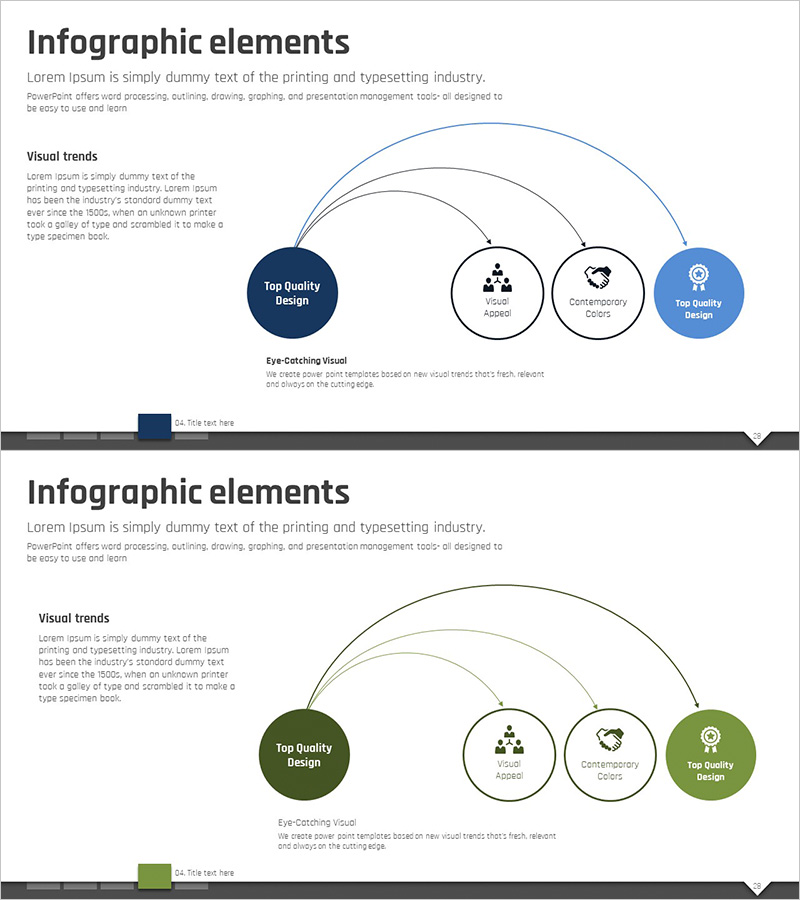
A radial expansion diagram PowerPoint slide that visually represents service and system operation plans. The structure radiates from a central core concept to three directional nodes, enabling you to organize key items such as service operation strategy, execution plan, and quality management in a hierarchical manner. The design combines dark blue accent colors with white circular nodes, providing high readability in presentation slides. This 2-slide set includes color variations in blue and green, ready for immediate use in diverse presentation scenarios.
Usage Points
-
Main Usage
Visualizes service and system operation strategies by radiating from a central core to surrounding detail items. Effectively communicates hierarchical relationships of operational approaches in executive reports, business briefings, and strategic presentations.
-
How to Use
Enter the core concept (e.g., Service Operation) in the central circular node, and add main execution items in the three directional nodes. After editing text, adjust colors and sizes to control emphasis. Optimized for 16:9 widescreen format.
-
Recommended For
Recommended for IT and service company operation strategy presentations, consulting firm business proposals, executive reports, organizational restructuring briefings, and process improvement presentations. Useful for explaining operational role distribution across departments and management levels.
-
Slide Structure
Slide 1: Dark blue accent version featuring 1 central circular node + 3 radial directional nodes + curved connector lines. Slide 2: Green accent version with identical structure. Each node is configured as a text input area, with light gray background throughout.
Related Products
-

Camping Isometric Service Implementation Plan – Innovation and Growth
#Technical Approach #Diagram #Text Box
-

Sea Wide PowerPoint Stage Diagram - Business Strategy and Service Execution
#Business Vision and Strategy #Technical Approach #Diagram
-

3 Core Strategy Processes - Stepwise Flow Towards Goals
#Technical Approach #Diagram #Service Operation Plan
-

Triangular Connection Diffusion Diagram – Clear Presentation of Services
#Technical Approach #Diagram #Service Operation Plan
