Connection Diffusion Composite Diagram for Service Operations
RJ0600108_10
- Last Update 07/20/2025
- File Size 0.1MB
- # of Slides 2
- File Format PPTX
- Slide Ratio 16:9
- Color
Keywords
- #Content-Based Slides
- #Design-Based Slides
- #Technical Approach
- #Diagram
- #Service Operation Plan
- #Service Implementation Plan
- #Cluster
- #Spread
- #Chain Diagram
- #Decentralized Diagram
- #16:9
- #connection diffusion diagram PowerPoint
- #4-segment diagram slide
- #composite diagram template
- #radial diagram PPT
- #service operations PowerPoint slide
About the Product
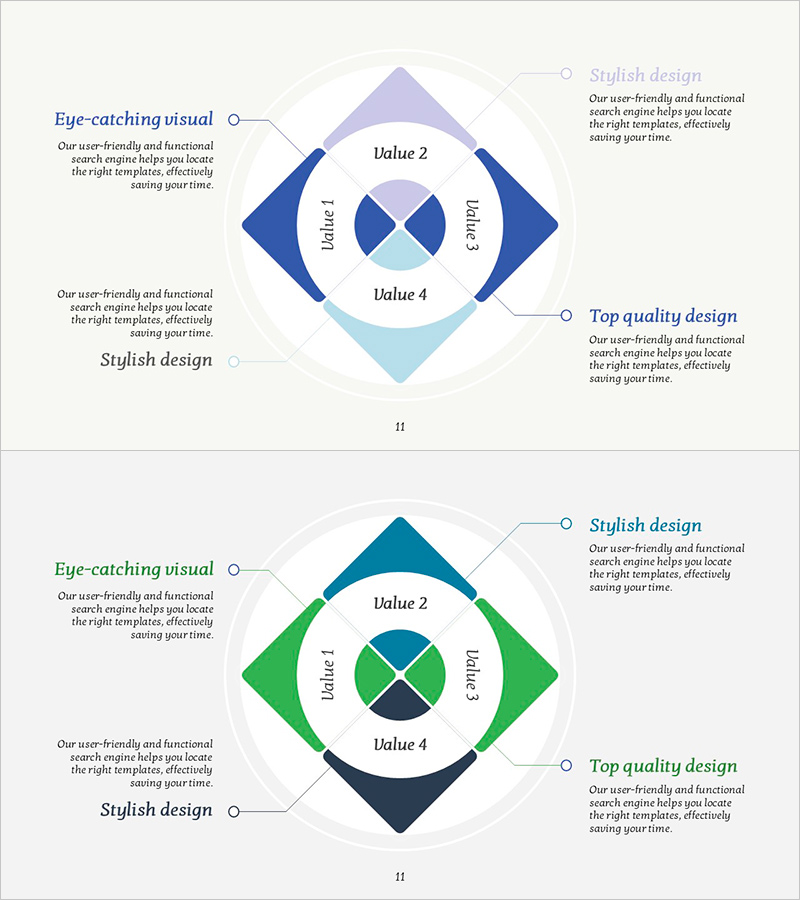
A 4-segment connection diffusion composite diagram PowerPoint slide designed to visualize service operations, business strategies, and organizational structures. The diagram features a central circular chart surrounded by four diamond-shaped nodes arranged in a radial pattern, rendered in blue, green, lavender, and light blue dual-tone colors. Each node accommodates Value 1 through Value 4 entries, with descriptive text areas positioned on both left and right sides. This 2-slide set is provided in 16:9 widescreen PPTX format, ready for immediate editing. Ideal for technology department presentations, service operations briefings, strategic planning sessions, and organizational communication materials.
Usage Points
-
Main Usage
Visualizes service operations, business strategies, organizational structures, and process flows by categorizing four core elements that radiate from a central focal point. Each segment accommodates Value 1–4 entries, making it suitable for strategic planning, operational planning, technology architecture explanations, and cross-functional team communications.
-
How to Use
Enter your core concept in the central circular chart, then populate the four diamond nodes with detailed items. Add descriptive text in the left and right text areas to complete the diagram. Colors can be customized by category or adjusted to match corporate brand guidelines.
-
Recommended For
IT technology teams explaining system architecture, service operations teams presenting operational plans, executives reporting strategic initiatives, consulting firms analyzing business models, startups pitching business concepts, and project managers outlining implementation frameworks.
-
Slide Structure
2-slide set. Each slide features a central 4-segment circular chart surrounded by four diamond-shaped nodes in a radial arrangement. Text description areas are positioned on the left and right sides, with connecting lines linking nodes to text regions. Four color segments—blue, green, lavender, and light blue—are applied to each divided area for visual distinction.
Related Products
-

Colored Pencil Connected Diagram – Service Operations and Execution
#Technical Approach #Diagram #Service Operation Plan
-

Halloween Connection Diagram – Creative Service Operations
#Technical Approach #Diagram #Service Operation Plan
-

Instrument Repair Diagram – Secrets of Technical Management
#Operational Plan #Technical Approach #Diagram
-

Accommodation Slide for Travel – Cluster Diagram Design
#Technical Approach #Diagram #Service Operation Plan
