Curved Chart Business Icon – Successful Marketing Strategy
RJ0600027_15
- Last Update 06/27/2025
- File Size 12.2MB
- # of Slides 2
- File Format PPTX
- Slide Ratio 16:9
- Color
Keywords
About the Product
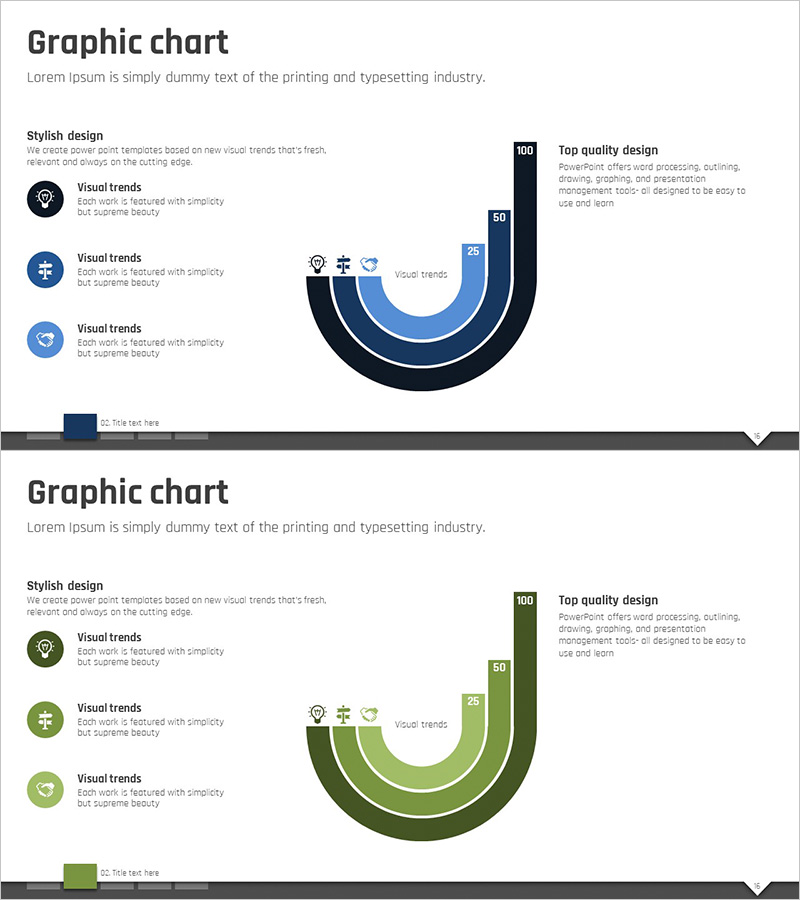
A curved chart PowerPoint slide designed for visualizing key performance indicators when establishing target market strategies. Provided in dual-tone blue and green color schemes, this presentation slide features a clearly separated layout with icon areas on the left and chart areas on the right. Each curved stage allows numeric input, and three business icons emphasize core marketing strategy elements. Instantly applicable for competitive advantage analysis, market share comparison, success metrics trends, and various business presentations.
Usage Points
-
Main Usage
Visualizes competitive advantages, market share, and success metrics using curved charts during target market strategy development. The blue and green dual-tone color scheme conveys both trust and growth potential, while the balanced composition of left icons and right chart maximizes information delivery impact.
-
How to Use
Input three core marketing strategy elements in the left icon area and enter stage-by-stage numeric values (25, 50, 100, etc.) in the right curved chart. Choose between blue or green color schemes and apply to various KPI comparisons such as ROI, customer satisfaction, or market growth rates.
-
Recommended For
Recommended for marketing planners, business strategy teams, sales leaders, and investor presentation managers presenting market analysis results, competitor comparisons, and growth forecasts. Particularly effective when comparing 3-5 performance metrics across stages.
-
Slide Structure
Two-slide set featuring blue-tone curved chart (first slide) and green-tone curved chart (second slide), each with numeric input capability for three stages. Each slide includes left text area (title and 3-line description), three left-side icons, and right-side curved chart area, optimized for 16:9 widescreen format.
Related Products
-

Wide Graph Presentation with Triangle Pattern
#Market and Competitor Analysis #Marketing Plan and Strategy #Graph
-

Target Market Blue Green Doughnut Chart – Visualizing Market Strategy
#Market and Competitor Analysis #Marketing Plan and Strategy #Graph
-

Visualizing Market Analysis with Line Chart – Securing Competitive Advantage
#Market and Competitor Analysis #Marketing Plan and Strategy #Graph
-

Market and Competitor Analysis PowerPoint Template
#Market and Competitor Analysis #Graph #Market Status
