Target Market Blue Green Doughnut Chart – Visualizing Market Strategy
RJ0600009_5
- Last Update 06/23/2025
- File Size 5.1MB
- # of Slides 2
- File Format PPTX
- Slide Ratio 16:9
- Color
Keywords
- #Content-Based Slides
- #Design-Based Slides
- #Market and Competitor Analysis
- #Marketing Plan and Strategy
- #Graph
- #Competitive Advantage
- #Target Market Strategy
- #Circles
- #Doughnut Chart
- #16:9
- #doughnut chart PowerPoint
- #pie chart template
- #market analysis slide
- #market share visualization
- #customer segmentation chart
- #marketing presentation template
About the Product
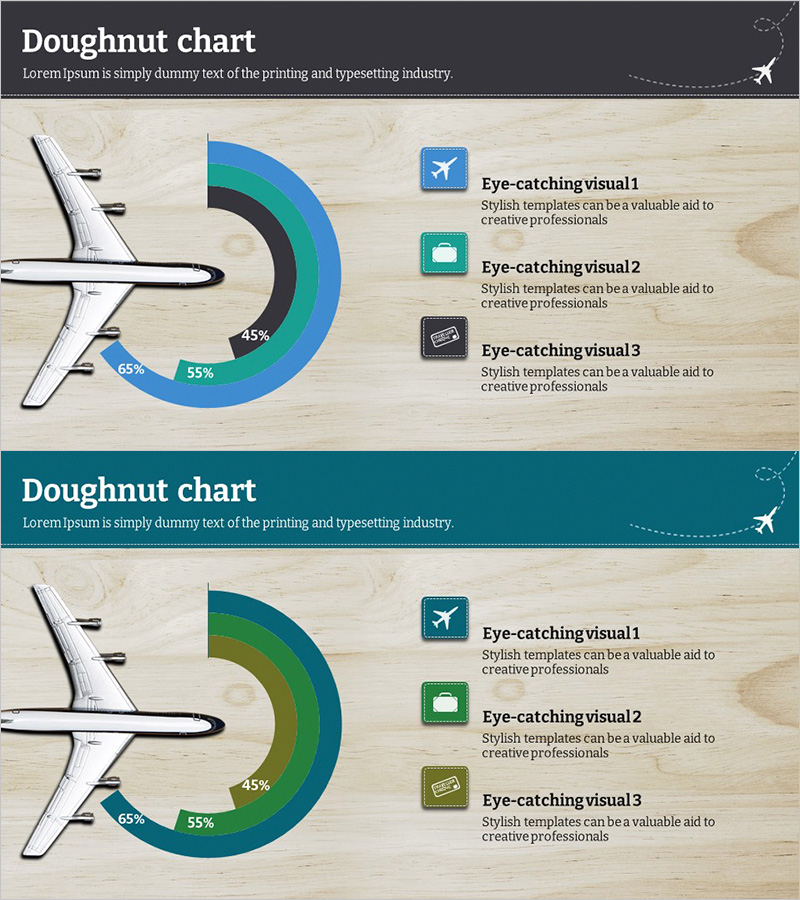
A professional doughnut chart PowerPoint slide optimized for target market analysis and marketing strategy presentations. The circular pie chart features blue, green, and black segments to intuitively represent market share, customer segmentation, sales distribution, and budget allocation. Ideal for B2B presentations in aviation, travel, and logistics industries to visualize market size and competitive landscape. The warm wood-tone background combined with icon elements creates a polished, corporate aesthetic. Includes 2 slide layouts with varied color combinations, fully editable in PPTX format for immediate use.
Usage Points
-
Main Usage
Effectively communicates proportional data such as market share, customer segmentation, sales distribution, and budget allocation. The hollow center of the doughnut allows placement of key metrics or titles, enhancing information clarity and visual impact.
-
How to Use
Deploy in marketing strategy presentations, business reports, investor pitch decks, and market analysis slideshows to compare competitors, illustrate regional revenue composition, and display customer demographic distribution. Input segment values to automatically update proportional percentages.
-
Recommended For
Marketing managers, executives, management consultants, and sales teams presenting market conditions and strategic initiatives. Particularly valuable for quarterly performance reports, new business proposals, and customer segmentation strategy development in B2B organizations.
-
Slide Structure
2-slide layout featuring 3-segment doughnut charts on each slide. First slide displays blue, green, and black color scheme; second slide offers darker tone variations. Each segment displays percentage values, with icon and text description areas on the right side for supplementary information.
Related Products
-

Genetically Modified Corn Analysis Circle Graph – Showcasing Competitive Advantage
#Market and Competitor Analysis #Graph #Competitive Advantage
-

Cell Phone Development Status Analysis Chart – Competitive Advantage and Insights
#Product/Service Introduction #Market and Competitor Analysis #Diagram
-

Data Analysis Donut Circle Graph – Visual Representation for Market and Competitive Analysis
#Business Introduction #Market and Competitor Analysis #Graph
-

Donut Chart by Lighting Sales Rankings – Market Data Analysis
#Market and Competitor Analysis #Financial Plans and Performance #Diagram
