Future Outlook Bar Graph – Visualizing Market Growth
RJ0400058_6
- Last Update 06/02/2025
- File Size 0.2MB
- # of Slides 2
- File Format PPTX
- Slide Ratio 16:9
- Color
Keywords
About the Product
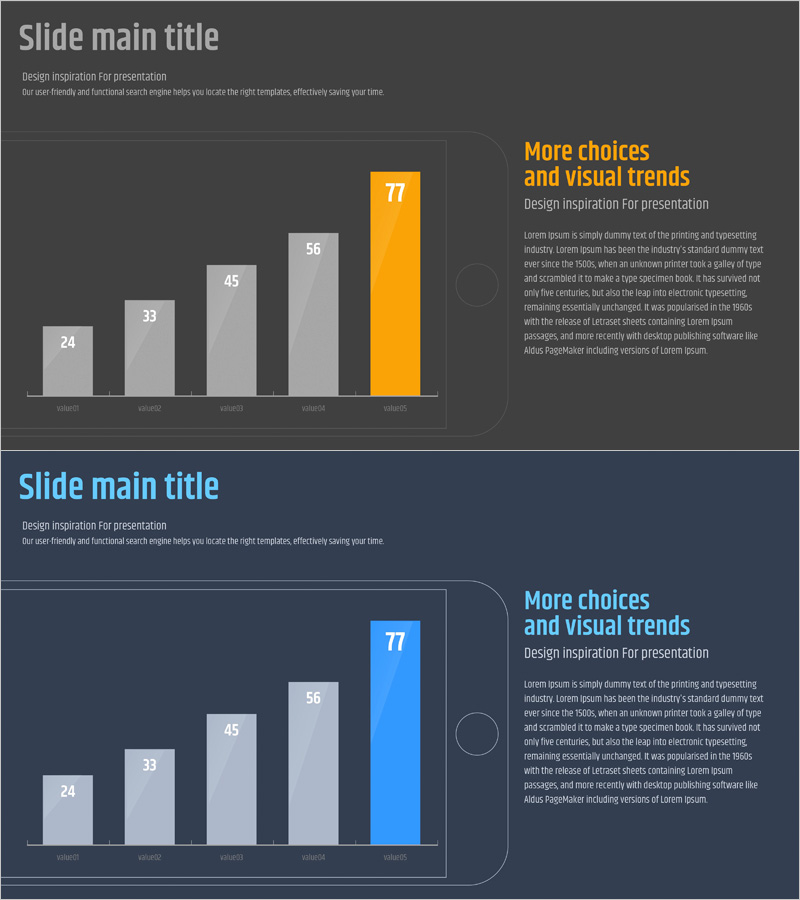
A PowerPoint slide that visualizes market growth trends and future outlook using a 5-step vertical bar chart. Set against a dark gray background, the bars use white, gray, and orange color series to distinguish data categories, with the final bar highlighted in orange to emphasize key metrics. The 2-slide set presents the same data in different layouts, optimized for 16:9 widescreen format. Ready to use immediately for executive reports, market analysis presentations, competitive benchmarking, and any business presentation requiring quantitative data visualization.
Usage Points
-
Main Usage
Comparative visualization of quantitative data across five stages and growth trends. Bar heights intuitively represent numerical values, while the orange-highlighted final bar emphasizes key messages such as future outlook or target values. Ideal for executive reports, quarterly performance presentations, and market analysis materials.
-
How to Use
Slide 1 features the basic layout; Slide 2 adds a text area on the right for additional context. Edit each bar height and color to match your data, then input analysis insights and conclusions in the right-side text box. Optimized for 16:9 widescreen displays.
-
Recommended For
Executive and C-level quarterly performance reports, marketing team market size and growth rate analysis, sales team competitive benchmarking, and strategic planning meetings requiring data-driven decision support. Recommended for all business presentations needing quantitative evidence.
-
Slide Structure
2-slide set. Slide 1: Title + 5-step vertical bar chart (white, gray, and orange series) + legend. Slide 2: Identical chart + right-side text area for analysis input. Each bar is independently editable with data value labels displayed at the top.
Related Products
-

Idea Development Future Outlook Graph – Essential Template for Market Analysis
#Market and Competitor Analysis #Graph #Future Outlook
-

Blue Red Analysis Chart – New Insights into Market Analysis
#Market and Competitor Analysis #Diagram #Graph
-

Future Outlook Analysis Bar Graph – Essential for Market Analysis
#Market and Competitor Analysis #Graph #Future Outlook
-

Business Future Outlook Analysis Diagram - Market Analysis and Competitive Advantage
#Market and Competitor Analysis #Graph #Future Outlook
