Analysis of Eco-friendly Activities by Region in the United States – Market and Competitive Analysis
RJ0600026_30
- Last Update 06/27/2025
- File Size 0.4MB
- # of Slides 2
- File Format PPTX
- Slide Ratio 16:9
- Color
Keywords
About the Product
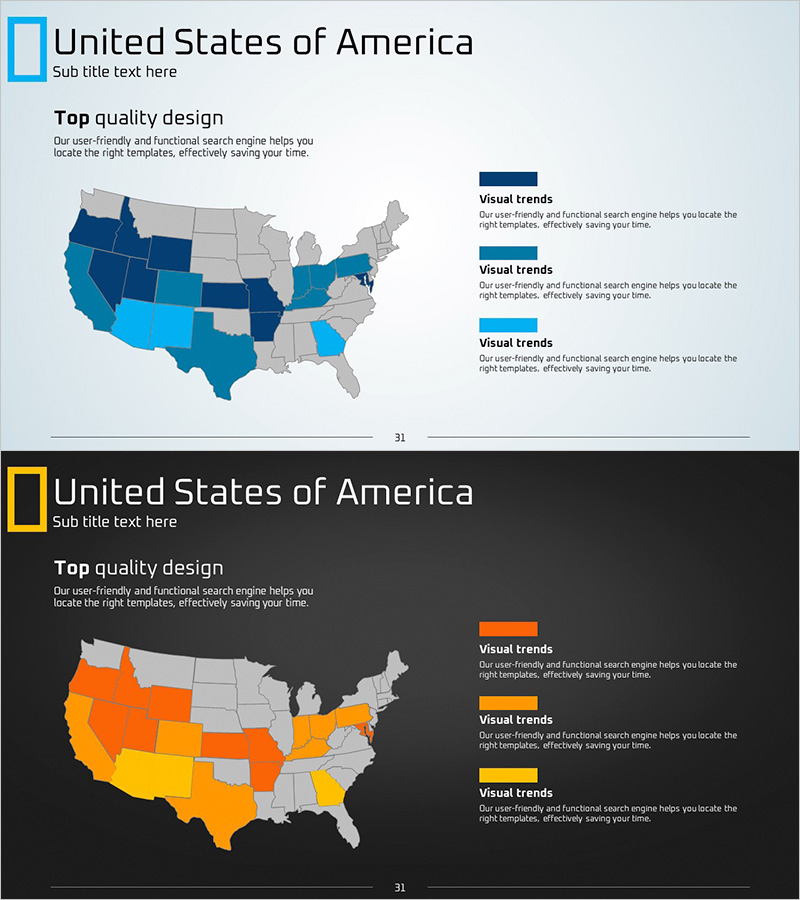
A PowerPoint slide visualizing eco-friendly activities across US regions through a color-coded geographic map. The slide features a light gray background with a gradient color scheme in dark blue, light blue, orange, and yellow to represent regional market intensity and competitive landscape. Delivered in 2-slide format with both light and dark theme designs, each slide uses a heatmap-style information structure where color saturation indicates regional data strength. Ready for immediate editing and insertion into presentations, this slide is particularly effective for market analysis sections when comparing competitive environments and developing regional strategies.
Usage Points
-
Main Usage
A heatmap-style slide that visualizes regional market data distribution and market concentration across the United States through color intensity, enabling quick comparison of eco-friendly activity patterns. Serves as evidence-based material in market analysis sections for identifying regional opportunities and threats, supporting data-driven regional strategy development.
-
How to Use
Insert into the market analysis section of business plans, marketing proposals, or investor pitch decks to explain regional market conditions. The light theme suits bright presentation venues while the dark theme works better in dimly lit projection environments. Easily customize the legend and text areas to match your specific regional data and business context.
-
Recommended For
Recommended for executives, marketing teams, strategy departments, and investor presentation specialists who need to analyze market conditions and competitive landscapes by region. Particularly valuable for regional market entry planning, competitive environment analysis, and sustainability-focused business proposals requiring data-backed decision support.
-
Slide Structure
2-slide set with Slide 1 featuring a light gray background (light theme) and Slide 2 with a black background (dark theme). Each slide contains 1 title area, 1 US regional map visualization, and 3 legend areas on the right side, with regional color intensity (dark blue, light blue, orange, yellow) representing data hierarchy and market strength.
Related Products
-

Global Map Camping Market Analysis by Country – Market Status and Opportunities
#Market and Competitor Analysis #Other #Market Analysis
-

Global Market Analysis Using World Map – Sea Lighthouse Concept
#Market and Competitor Analysis #Diagram #Other
-

Asian Target Market Analysis Graph
#Market and Competitor Analysis #Graph #Other
-

Gender Ratio Analysis of Coffee Consumers - Consumption Patterns of Men and Women
#Market and Competitor Analysis #Graph #Other
