Light Bulb Icon Cycle Diagram – Business Strategy and Operations
RJ0600026_13
- Last Update 06/27/2025
- File Size 0.3MB
- # of Slides 2
- File Format PPTX
- Slide Ratio 16:9
- Color
Keywords
- #Content-Based Slides
- #Design-Based Slides
- #Business Strategy
- #Operational Plan
- #Diagram
- #Production and Technology Development Strategy
- #Flow
- #Circular Flow
- #16:9
- #cycle diagram PowerPoint
- #5-node circular flow slide
- #light bulb icon presentation
- #business strategy diagram
- #operational cycle template
About the Product
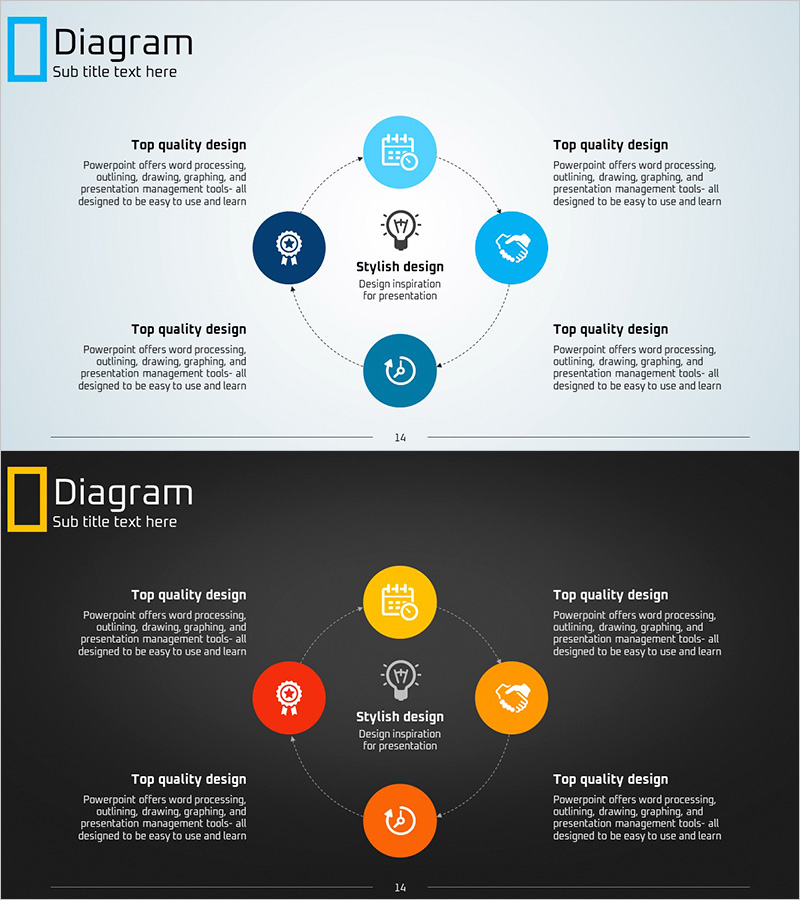
A 5-node circular cycle diagram PowerPoint slide designed to visualize business strategy execution and operational cycles. The central light bulb icon is surrounded by five nodes positioned at cardinal and diagonal points, connected by dotted arrows to create a clear circular flow structure. The design uses light blue, dark blue, and sky blue circular nodes with icons to emphasize each stage's role, with ample text areas for detailed strategy elements, action items, and performance metrics. The 2-slide set includes both light and dark background versions for flexible presentation environments. Fully editable PPTX format.
Usage Points
-
Main Usage
Ideal for expressing business execution processes, operational cycles, and strategic implementation stages in a circular structure. The central light bulb icon symbolizes core ideas, innovation, and objectives, while the five surrounding nodes represent execution elements, departments, or roles. Perfect for executive presentations, strategy meetings, and organizational training to emphasize cyclical thinking and continuous improvement culture.
-
How to Use
Enter strategy phase names, responsible departments, action items, and performance metrics in each node's text area. Present the circular process by reading clockwise, or use a radial structure expanding from the central icon to detailed execution steps. Customize colors to differentiate priorities, departments, or time phases for enhanced clarity and impact.
-
Recommended For
Recommended for executives, strategy managers, project leaders, and organizational development professionals presenting business strategies, operational plans, and process improvements. Particularly effective for presentations requiring cyclical thinking such as PDCA quality management, continuous improvement initiatives, and innovation management. Also valuable for visualizing multi-departmental collaboration structures.
-
Slide Structure
Central gray circular node containing a light bulb icon, surrounded by five colored circular nodes (light blue, dark blue, sky blue, orange, and additional accent colors) positioned at cardinal and diagonal points. Each node is connected by dotted directional arrows forming a clockwise circular flow. Text input areas are positioned adjacent to each node for content entry. Two versions provided: light background (Slide 1) and dark background (Slide 2).
Related Products
-

Infographic Slide Highlighting the Coffee Bean Development Process
#Business Strategy #Operational Plan #Diagram
-

Visualizing Business Strategy with Circular Diagram – Quality and Innovation
#Business Strategy #Operational Plan #Diagram
-

Circular System for Achieving Dreams
#Business Strategy #Technical Approach #Diagram
-

Eco-friendly Business Direction Leaf Connection Diagram
#Business Strategy #Operational Plan #Diagram
