Infographic Slide Highlighting the Coffee Bean Development Process
RJ0600003_14
- Last Update 06/21/2025
- File Size 4.4MB
- # of Slides 2
- File Format PPTX
- Slide Ratio 16:9
- Color
Keywords
- #Content-Based Slides
- #Design-Based Slides
- #Business Strategy
- #Operational Plan
- #Diagram
- #Production Plan
- #Production and Technology Development Strategy
- #Flow
- #Spread
- #Circular Flow
- #Centralized Diagram
- #16:9
- #radial diagram PowerPoint
- #4-node diagram slide
- #process flow diagram
- #hub-and-spoke diagram PowerPoint
- #business process visualization slide
- #how to create radial diagram in PowerPoint
About the Product
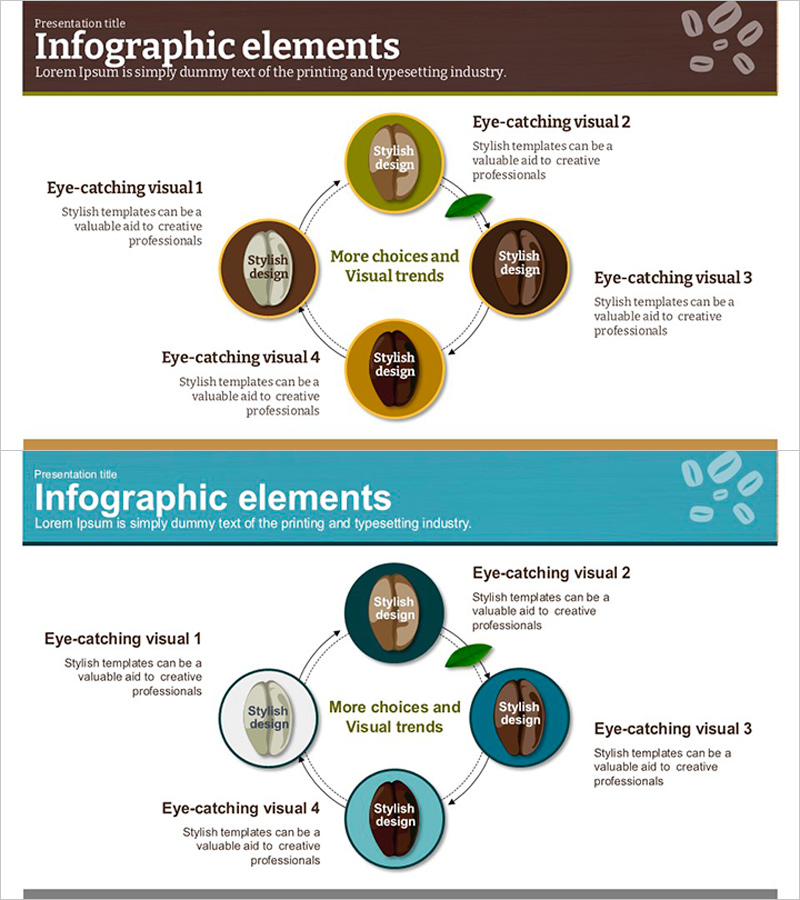
A radial diagram PowerPoint slide where a central concept branches into four directional nodes connected by arrows. Features circular nodes in brown, olive, and teal tones that visualize process stages, strategic elements, or organizational roles. Includes 2 slides: one with a brown background and one with a teal background, both fully editable with text and icon placeholders in each node. Perfect for business strategy presentations, product development workflows, marketing channel distribution, organizational structure explanations, and any content requiring a hub-and-spoke visual structure.
Usage Points
-
Main Usage
Visually represents a central concept expanding into four key elements, stages, channels, or roles. Ideal for illustrating process flows, strategic branches, organizational hierarchies, product development phases, marketing channel distribution, and any hub-and-spoke relationship structure.
-
How to Use
Enter your core concept in the central circular node (e.g., product name, strategic goal, organization name). Fill the four surrounding nodes with supporting details and customize text and icons to match your presentation content. Choose between brown or teal background versions to align with your slide theme.
-
Recommended For
Business strategists, product managers, marketing professionals, organizational leaders, management consultants, and educators presenting business strategy, product development processes, marketing channel structures, organizational roles, business models, and project management phases.
-
Slide Structure
2-slide set: Slide 1 features a brown background with brown, olive, and gold circular nodes; Slide 2 has a teal background with teal, dark blue, and white nodes. Each node connects to the central circle via arrows and includes editable text areas and icon placement zones.
Related Products
-

Game System Diagram for Visualizing Operational Plans – Streamlining Processes Efficiently
#Operational Plan #Diagram #Production and Technology Development Strategy
-

Interior Design Work System – Engaging Diagram Utilization
#Business Strategy #Operational Plan #Diagram
-

Agricultural Aftercare and Maintenance Strategy Circular Icon
#Operational Plan #Diagram #Production and Technology Development Strategy
-

Design Technology Systems and Strategies – Emphasizing Strategies with Data Visualization
#Business Strategy #Operational Plan #Diagram
