Market Trend Line Graph – The Power of Trust and Analysis
RJ0600023_7
- Last Update 06/27/2025
- File Size 0.1MB
- # of Slides 2
- File Format PPTX
- Slide Ratio 16:9
- Color
Keywords
About the Product
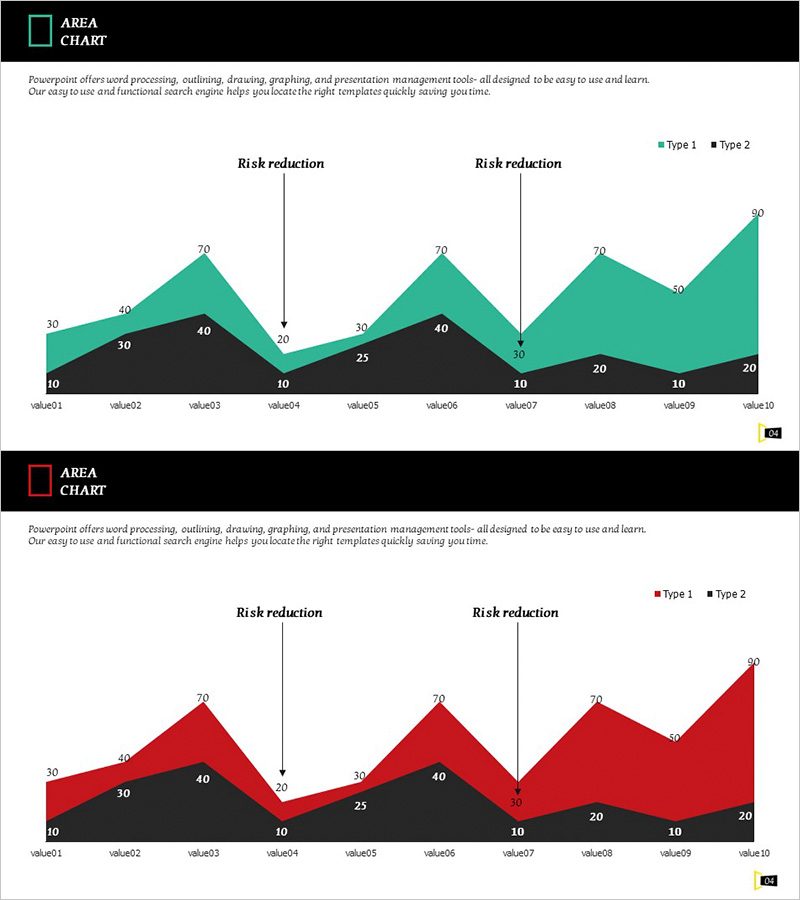
A dual-series area chart PowerPoint slide designed to visualize market trends and comparative data analysis. The slide features green and red data series across 10 data points, with risk reduction markers highlighting key inflection points. This two-slide presentation template uses a 16:9 widescreen format and enables clear visualization of trend changes, making it ideal for executive reports and strategic presentations. The editable chart structure allows quick customization of data values and color schemes.
Usage Points
-
Main Usage
Visualize two or more data series simultaneously to compare trends, track performance metrics, and analyze market dynamics. The stacked area format allows viewers to see both individual series changes and cumulative effects, making it ideal for financial reports, sales performance reviews, and competitive benchmarking presentations.
-
How to Use
Replace the placeholder data points (value01 through value10) with your actual figures. The green series represents positive indicators while the red series shows risk factors. Customize colors, legend labels, and risk reduction markers to match your presentation narrative and corporate branding guidelines.
-
Recommended For
Financial analysts, marketing managers, executives, management consultants, and business strategists. Suitable for quarterly performance reviews, market share tracking, competitive analysis, risk assessment presentations, and strategic planning sessions where dual-metric comparison is essential.
-
Slide Structure
Two-slide template featuring dual-series area charts with 10 data points each. Green (Type 1) and red (Type 2) areas overlap to show comparative trends. Vertical lines mark risk reduction zones, emphasizing critical turning points. 16:9 widescreen format optimized for modern display environments and projection systems.
Related Products
-

Battery Shape Vertical Bar Graph – Competitor Analysis
#Technical Approach #Market and Competitor Analysis #Graph
-

Speed Timer Diagram for Market Share Analysis
#Market and Competitor Analysis #Diagram #Graph
-

Natural Environment Satisfaction Graph – Market and Customer Analysis
#Market and Competitor Analysis #Graph #Customer Analysis
-

3D Area Chart (Green & Blue) – New Possibilities in Data Visualization
#Graph
