Natural Environment Market Analysis Graph – Visualizing Market Trends
RJ0600020_4
- Last Update 06/26/2025
- File Size 0.8MB
- # of Slides 2
- File Format PPTX
- Slide Ratio 16:9
- Color
Keywords
- #Content-Based Slides
- #Design-Based Slides
- #Market and Competitor Analysis
- #Graph
- #Other
- #Industry Trends
- #16:9
- #area chart PowerPoint slide
- #market analysis presentation template
- #natural environment market trends visualization
- #dual-layer data comparison slide
- #how to create market trend charts in PowerPoint
About the Product
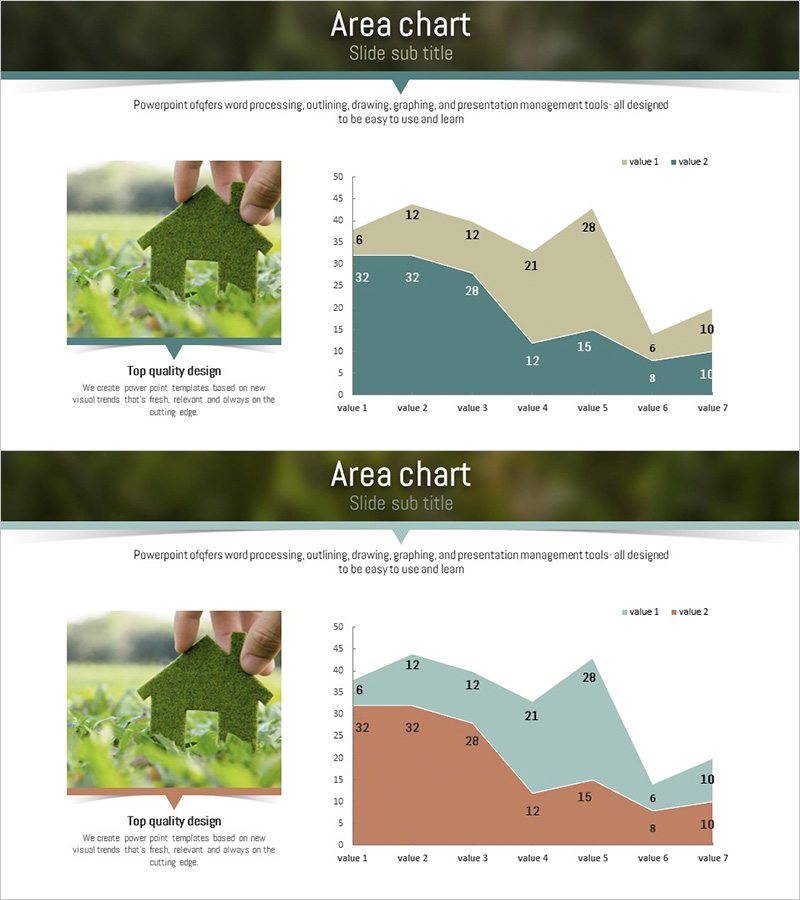
An area chart PowerPoint slide designed to visualize natural environment market trends across two data series and seven time points. The layout features a dark green header with teal and beige layered areas that intuitively convey market progression and comparative patterns. The left side accommodates a thematic image, while the right side displays a clearly labeled chart with numerical values. This presentation slide is immediately editable and ready for market analysis sections in business reports, investor pitches, and strategic presentations.
Usage Points
-
Main Usage
Optimized for market analysis sections to visualize market size changes and competitive dynamics in natural resource and environmental industries. The dual-layer area chart effectively communicates growth rates, market share shifts, and competitive positioning across seven data points.
-
How to Use
Insert relevant environmental or green industry imagery in the left image area. Replace chart legends, values, and axis labels with actual market data. Update the header title and subtitle to match your presentation context, then integrate into your slide deck.
-
Recommended For
Ideal for market analysis presentations in environmental, energy, agriculture, forestry, and aquaculture sectors. Suitable for investor relations, business plans, market research reports, and executive briefings where market trend visualization is essential.
-
Slide Structure
Header section (title and subtitle) with left image placeholder and right area chart displaying two data series across seven time points with legend and value labels. Contains three text input areas (title, subtitle, description) and fourteen data input fields (two series × seven time points).
Related Products
-

Area Chart for Market Trend Analysis – Insights and Growth
#Market and Competitor Analysis #Financial Plans and Performance #Graph
-

Camera and Line Chart Comparison - Market Trends and Future Outlook
#Market and Competitor Analysis #Graph #Other
-

Marketing Effectiveness Analysis Mixed Graph – Insights into Market Trends
#Market and Competitor Analysis #Graph #Other
-

Core Technologies of AI Chipsets: Performance Characteristics
#Market and Competitor Analysis #Diagram #Graph
