Introduction to Farm Business Strategy – Blue Green Slide
RJ0600019_5
- Last Update 06/26/2025
- File Size 0.3MB
- # of Slides 2
- File Format PPTX
- Slide Ratio 16:9
- Color
Keywords
- #Content-Based Slides
- #Design-Based Slides
- #Business Vision and Strategy
- #Business Strategy
- #Diagram
- #Business Goals
- #Production Plan
- #Flow
- #Linear Flow
- #16:9
- #linear timeline diagram PowerPoint
- #3-stage business strategy slide
- #farm business presentation
- #business roadmap slide template
- #timeline infographic PowerPoint slide
About the Product
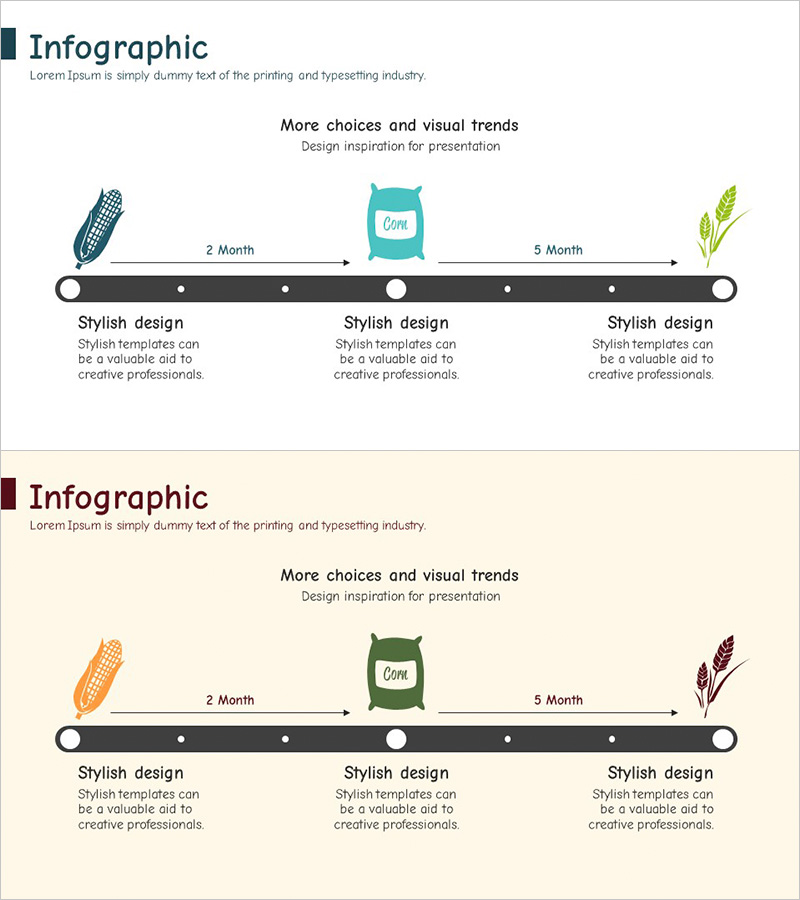
A linear timeline PowerPoint slide that visualizes farm business strategy across three sequential stages with time-based progression. This 2-slide set offers both blue and green color versions, each featuring icons, time labels, and text areas to clearly represent business objectives and implementation schedules. Available in 16:9 widescreen PPTX format for immediate editing, it's ideal for business plans, strategy presentations, project roadmaps, and progress reports. The timeline structure effectively communicates milestones, phase-by-phase goals, and project timelines in professional presentations.
Usage Points
-
Main Usage
Presents business implementation plans as sequential stages over time, clearly visualizing objectives and timelines for each phase. Ideal for farm business strategies, project roadmaps, business plan presentations, and progress reports where time-based progression and milestone tracking are essential.
-
How to Use
Enter business objectives, implementation details, and expected timelines in each stage's text area. Customize icons to reflect each phase's characteristics. Use the blue version for technology and innovation-focused strategies, and the green version for sustainability and environmental initiatives. Select the color scheme that best matches your presentation context.
-
Recommended For
Farm business owners, agricultural managers, business planners, investment officers, and marketing professionals preparing business plans, strategy presentations, investor pitches, and progress reports. Suitable for any business presentation requiring emphasis on phased implementation and timeline visualization.
-
Slide Structure
2-slide set with each slide featuring a linear timeline of 3 nodes (stages). Each node includes an icon, time period label, and text description area connected by directional arrows. The blue version uses dark blue backgrounds with bright icons; the green version features a beige background with green accent elements for visual distinction.
Related Products
-

Vehicle Production Plan Diagram – Business Vision and Implementation Strategy
#Business Vision and Strategy #Business Strategy #Diagram
-

Baking with Flour Presentation Slide
#Business Vision and Strategy #Business Strategy #Diagram
-

Ship-Carrying System Diagram – Flow and Cluster
#Business Strategy #Business Management #Diagram
-

Setting Goals with a Strong Foundation – Business Strategy Slide
#Business Vision and Strategy #Marketing Plan and Strategy #Diagram
