Farm Icon Donut Chart – Data Visualization and Analysis
RJ0600019_15
- Last Update 06/25/2025
- File Size 0.4MB
- # of Slides 2
- File Format PPTX
- Slide Ratio 16:9
- Color
Keywords
- #Content-Based Slides
- #Design-Based Slides
- #Product/Service Introduction
- #Market and Competitor Analysis
- #Graph
- #Development Status
- #Market Status
- #Circles
- #Doughnut Chart
- #16:9
- #donut chart PowerPoint
- #pie chart slide template
- #farm icon data visualization
- #percentage chart presentation
- #how to create donut chart in PowerPoint
About the Product
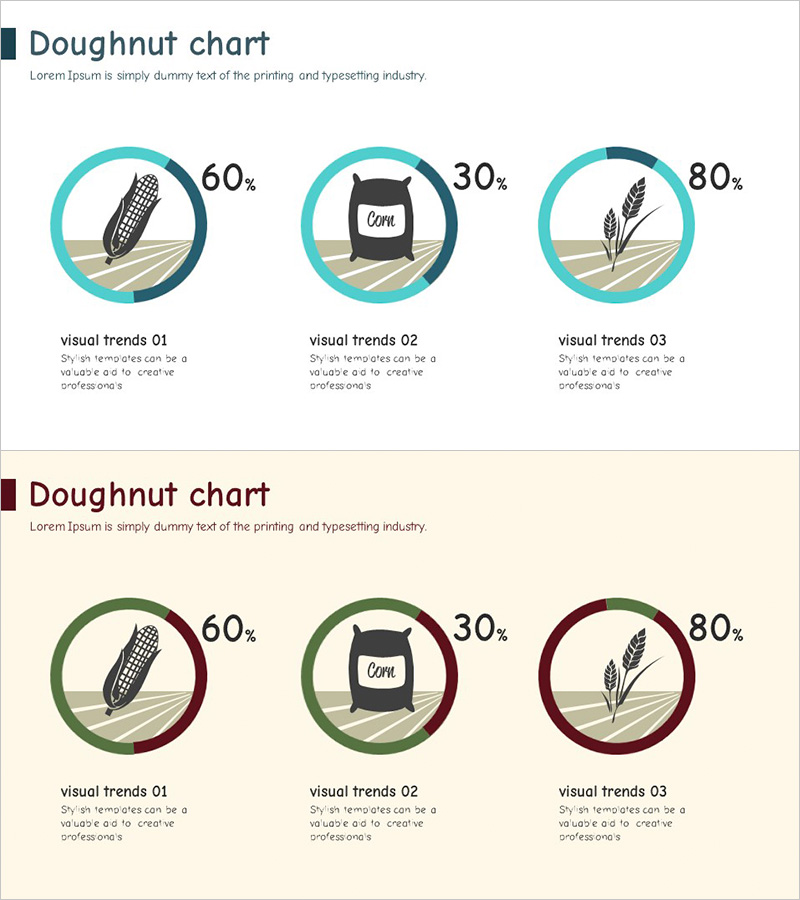
A 2-slide PowerPoint presentation featuring donut charts with farm-themed icons for data visualization. The slides display three donut charts showing 60%, 30%, and 80% proportions, each centered with corn, grain, and wheat illustrations. The design uses turquoise and dark green or burgundy two-tone backgrounds, making it ideal for market analysis, competitive analysis, and sales composition presentations. Available in 16:9 widescreen PPTX format, fully editable and ready to customize with your own data.
Usage Points
-
Main Usage
Present ratio, composition, and market share data visually in business presentations using donut chart slides. Perfect for agriculture, food, and agribusiness industries to communicate market analysis, sales composition breakdown, and competitive market share comparisons in an intuitive, visual format.
-
How to Use
Replace the percentage values and icons with your own data. Choose between the turquoise-background or beige-background slide design based on your presentation context. The clearly separated text and chart areas allow easy addition of supporting descriptions and analysis notes for each data segment.
-
Recommended For
Agriculture and food industry professionals, business analysts, market research presenters, executives preparing reports, sales performance analysts, and anyone needing to compare ratio-based data. Suitable for any business presentation requiring visual proportion representation and market segment analysis.
-
Slide Structure
2-slide set with 3 donut charts per slide (displaying 60%, 30%, and 80% values). Each chart features a centered farm icon (corn, grain, or wheat). Below each chart are 'visual trends 01-03' labels and text areas for adding data interpretation and supporting commentary for each segment.
Related Products
-

Visually Appealing Presentation Slide – Stylish Design
#Product/Service Introduction #Market and Competitor Analysis #Graph
-

Doughnut Chart for Mobile Network Development and Market Status Visualization
#Product/Service Introduction #Market and Competitor Analysis #Graph
-

Leaves Donut Chart – Fresh Approach to Data Visualization
#Product/Service Introduction #Market and Competitor Analysis #Diagram
-

Mobile App Market Share Analysis Graph
#Product/Service Introduction #Market and Competitor Analysis #Diagram
