Doughnut Chart for Mobile Network Development and Market Status Visualization
RJ0400024_5
- Last Update 05/24/2025
- File Size 2.3MB
- # of Slides 2
- File Format PPTX
- Slide Ratio 16:9
- Color
Keywords
- #Content-Based Slides
- #Design-Based Slides
- #Product/Service Introduction
- #Market and Competitor Analysis
- #Graph
- #Development Status
- #Market Status
- #Circles
- #Doughnut Chart
- #16:9
- #doughnut chart PowerPoint slide
- #pie chart presentation template
- #ratio data visualization
- #circular graph slide
- #data visualization PPT
About the Product
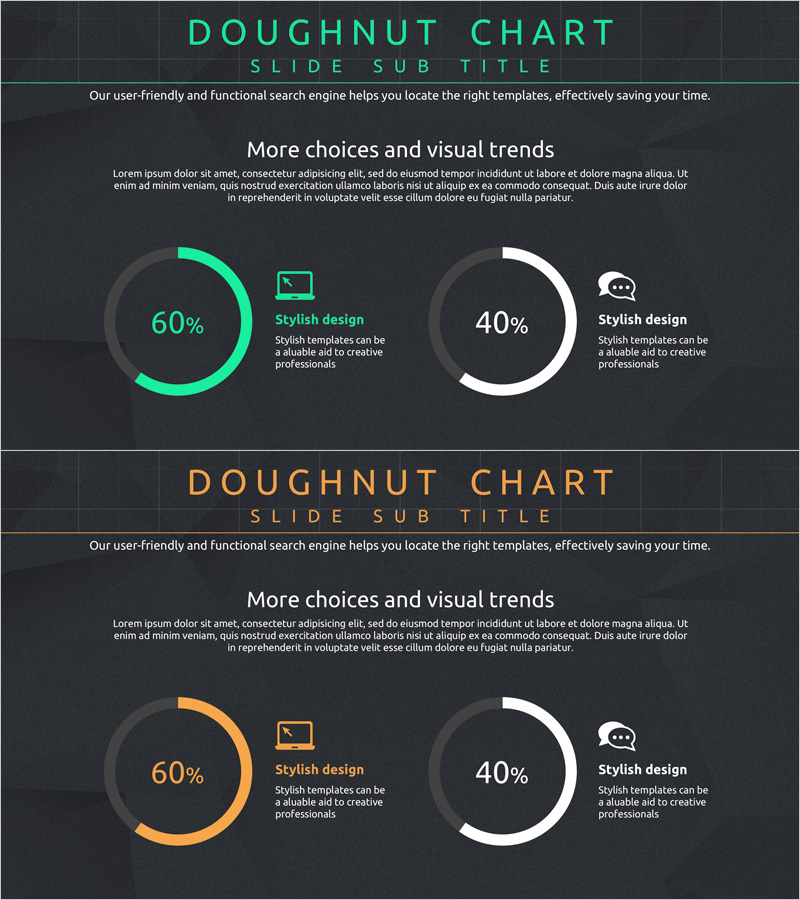
A professional doughnut chart PowerPoint slide set that visualizes mobile network development status and market trends with clarity and impact. This 2-slide presentation features two color variations—teal and orange accent tones—each displaying ratio data (60% and 40%) on a dark background. The slides include clear numerical labels and supporting icons to enhance your presentation's data section. Formatted in 16:9 widescreen and fully editable in PPTX, these slides integrate seamlessly into business reports, market analysis decks, and investor presentations.
Usage Points
-
Main Usage
Designed to clearly visualize ratio data and market share comparisons using doughnut chart format. Ideal for presenting mobile network development metrics, market trends, customer satisfaction rates, and technology adoption percentages. The combination of numerical values and supporting icons enhances information clarity and audience engagement.
-
How to Use
Integrate these slides into business reports, marketing strategy presentations, and investor pitch decks within the market analysis section. Replace the default percentages and labels with your own data, and adjust colors to match your corporate branding. The dark background design ensures excellent readability in projector environments and on-screen presentations.
-
Recommended For
Recommended for mobile telecommunications professionals, network technology planners, marketing managers, and executives preparing board-level reports. Suitable for any presentation requiring market status analysis, competitive benchmarking, or technology adoption rate explanations.
-
Slide Structure
Two-slide layout with one doughnut chart per slide. Slide 1 features a teal-accented doughnut (60% representation), while Slide 2 displays an orange-accented doughnut (40% representation), providing color variation options. Each chart includes adjacent icon and text areas for supplementary information and custom labels.
Related Products
-

Visually Appealing Presentation Slide – Stylish Design
#Product/Service Introduction #Market and Competitor Analysis #Graph
-

Farm Icon Donut Chart – Data Visualization and Analysis
#Product/Service Introduction #Market and Competitor Analysis #Graph
-

Leaves Donut Chart – Fresh Approach to Data Visualization
#Product/Service Introduction #Market and Competitor Analysis #Diagram
-

Mobile App Service Development Status – Doughnut Chart Visualization
#Product/Service Introduction #Business Introduction #Graph
