Carbon Neutral Market Share Chart – Visualizing Competitive Advantage
RJ0600018_28
- Last Update 06/25/2025
- File Size 0.5MB
- # of Slides 2
- File Format PPTX
- Slide Ratio 16:9
- Color
Keywords
- #Content-Based Slides
- #Design-Based Slides
- #Market and Competitor Analysis
- #Diagram
- #Graph
- #Competitive Advantage
- #Table
- #Column
- #Standard Table
- #Column Chart
- #16:9
- #vertical bar chart PowerPoint
- #market share comparison slide
- #3-series grouped bar graph
- #data visualization template
- #competitive advantage chart
About the Product
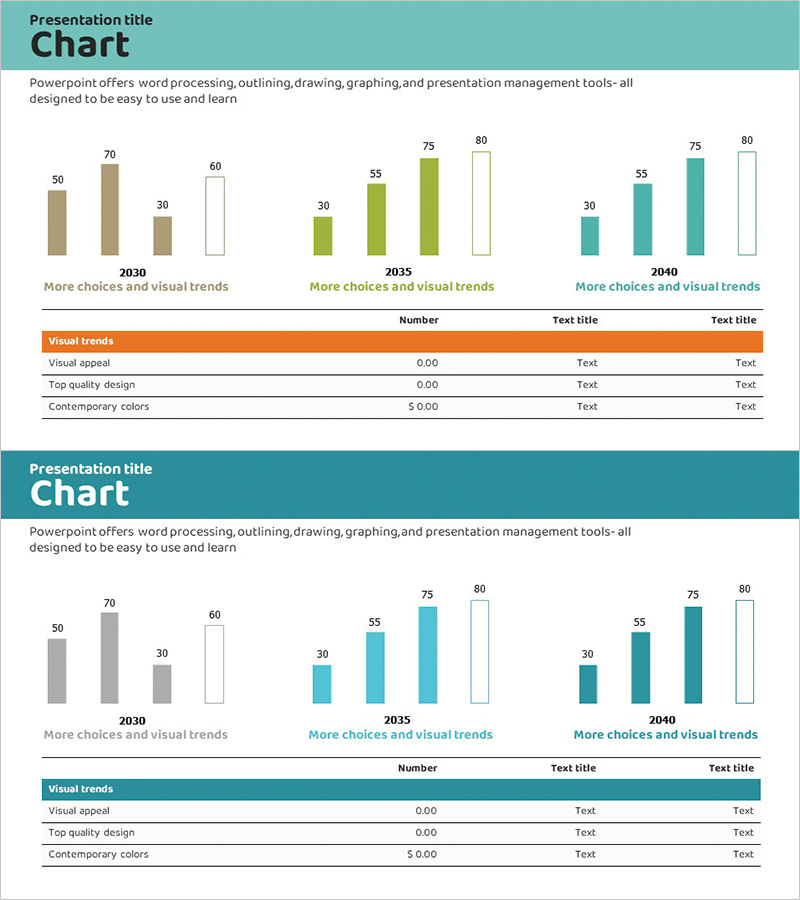
A vertical bar chart PowerPoint slide comparing carbon-neutral market share across three data series. Visualizes data for 2030, 2035, and 2040 with four items per time period displayed as grouped bars. Uses three color schemes—tan, lime green, and teal—to distinguish data series, with clear numerical labels on a white background. Ready-to-use for competitive analysis presentations, market trend reports, and business performance slides.
Usage Points
-
Main Usage
Visualizes multi-series data across time periods to show market share trends, competitive positioning, and business performance. The grouped bar format enables direct comparison of four items across three years, with numerical labels ensuring precise data communication. Ideal for executive briefings, investor presentations, and strategic planning meetings.
-
How to Use
Open the slide and replace existing values with your data using PowerPoint's chart editing tools. Adjust bar heights, colors, and labels to match your dataset. Customize background colors and fonts to align with corporate branding. During presentation, highlight individual series by clicking on bars to focus audience attention.
-
Recommended For
Executives, business development teams, marketing departments, finance teams, and consultants presenting market analysis, competitive strategy, and performance reports. Suitable for carbon-neutral and ESG business briefings, quarterly and annual performance reviews, and investor relations materials.
-
Slide Structure
Two-slide set. First slide features tan, lime, and teal 3-series bars comparing four items across 2030, 2035, and 2040. Second slide offers the same structure in gray and teal for alternative color selection. 16:9 widescreen format in PPTX, fully editable in all PowerPoint versions.
Related Products
-

Typographic Wide Template Bar Chart & Table – Competitive Analysis and Performance
#Market and Competitor Analysis #Financial Plans and Performance #Diagram
-

Car Wide Template Vertical Bar Graph – Market Analysis and Competitive Advantage
#Market and Competitor Analysis #Financial Plans and Performance #Graph
-

Competitor Analysis Bar Graph - Visualizing Market Status
#Market and Competitor Analysis #Graph #Competitor Analysis
-

Sophisticated Vertical Bar Chart – Market Trend Analysis
#Market and Competitor Analysis #Graph #Industry Trends
