Infographic Slide for Service Deployment Strategy
RM0200017_15
- Last Update 09/19/2025
- File Size 0.5MB
- # of Slides 2
- File Format PPTX
- Slide Ratio 16:9
- Color
Keywords
- #Content-Based Slides
- #Design-Based Slides
- #Product/Service Introduction
- #Technical Approach
- #Diagram
- #Differentiation Strategy for Products/Services
- #Service Implementation Plan
- #Flow
- #Structure
- #Linear Flow
- #Pyramid Chart
- #16:9
- #service deployment strategy PowerPoint
- #layered structure diagram
- #3-step infographic slide
- #process flow PPT template
- #data visualization PowerPoint
- #how to create deployment strategy in PowerPoint
About the Product
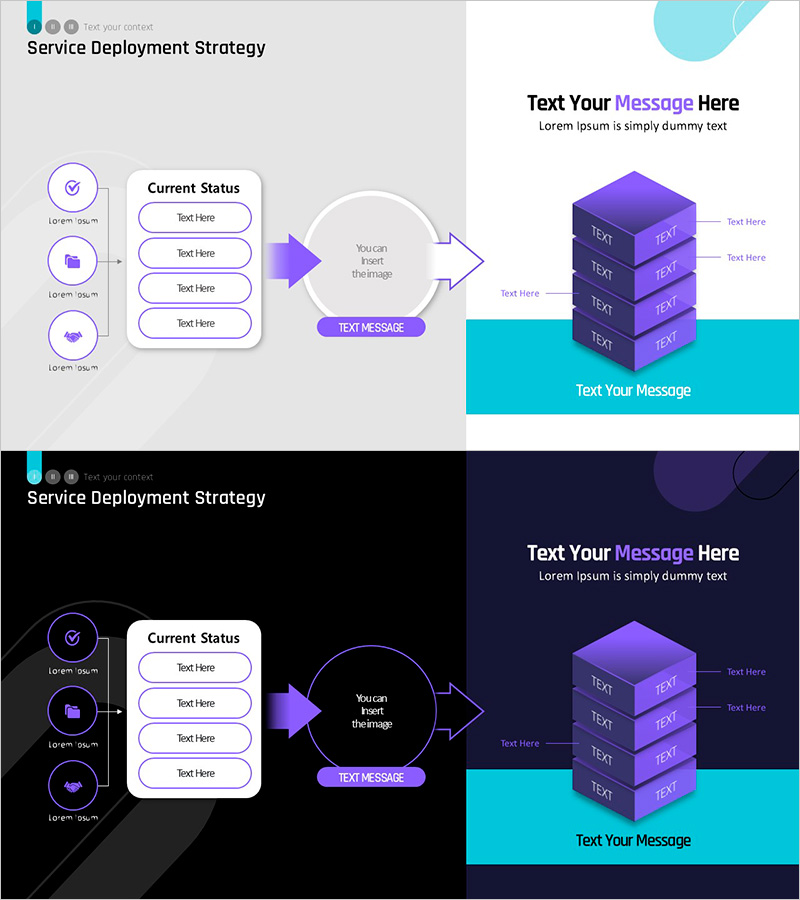
A three-tier layered infographic PowerPoint slide that visually represents service deployment strategy with process flow and hierarchical data structure. The design features three status icons on the left, a central process flow with directional arrows, and a purple 3D stacked structure on the right, each with dedicated text input areas. The light and dark theme versions use turquoise and purple accent colors with white text boxes to organize information, making it ideal for IT services, cloud deployment, and system migration presentations. The two-slide deck adapts to various presentation environments and display settings.
Usage Points
-
Main Usage
Presents IT service deployment, cloud migration, and system implementation projects as a three-phase process in a single infographic view. Clearly communicates the progression from current state analysis through deployment strategy to final deliverables, enhancing stakeholder understanding.
-
How to Use
Enter current status information in the three left-side icons, describe deployment strategy phases in the central arrow section, and specify final outcomes in the right-side 3D stack. All text boxes are fully editable, and colors and icons can be customized to match your organization's branding guidelines.
-
Recommended For
IT planners, solution architects, project managers, and technical sales professionals use this slide in client meetings, executive briefings, and proposal presentations to explain complex deployment strategies in a clear, concise manner.
-
Slide Structure
Slide 1 (Light Theme): Three left-side status icons with text boxes / Central circular process node with bidirectional arrows / Right-side 3D stacked structure (3 layers) with text labels. Slide 2 (Dark Theme): Identical layout with black background and purple accent emphasis. 16:9 widescreen format optimized for modern projectors and online meeting platforms.
Related Products
-

Business Direction Set by Keyword Integration
#Product/Service Introduction #Business Strategy #Diagram
-

Differentiated Promotion Strategy Presentation Template – Emphasizing Marketing and Innovation
#Product/Service Introduction #Marketing Plan and Strategy #Diagram
-

Blue Line Wide Template Directional Diagram2 – Visual Flow and Effective Communication
#Product/Service Introduction #Operational Plan #Diagram
-

Visualizing Summer Strategy with Diagram Presentation
#Product/Service Introduction #Business Vision and Strategy #Diagram
