Environmental Protection Chart Diagram – Vision for Sustainable Development
RJ0600015_9
- Last Update 06/24/2025
- File Size 2.7MB
- # of Slides 2
- File Format PPTX
- Slide Ratio 16:9
- Color
Keywords
About the Product
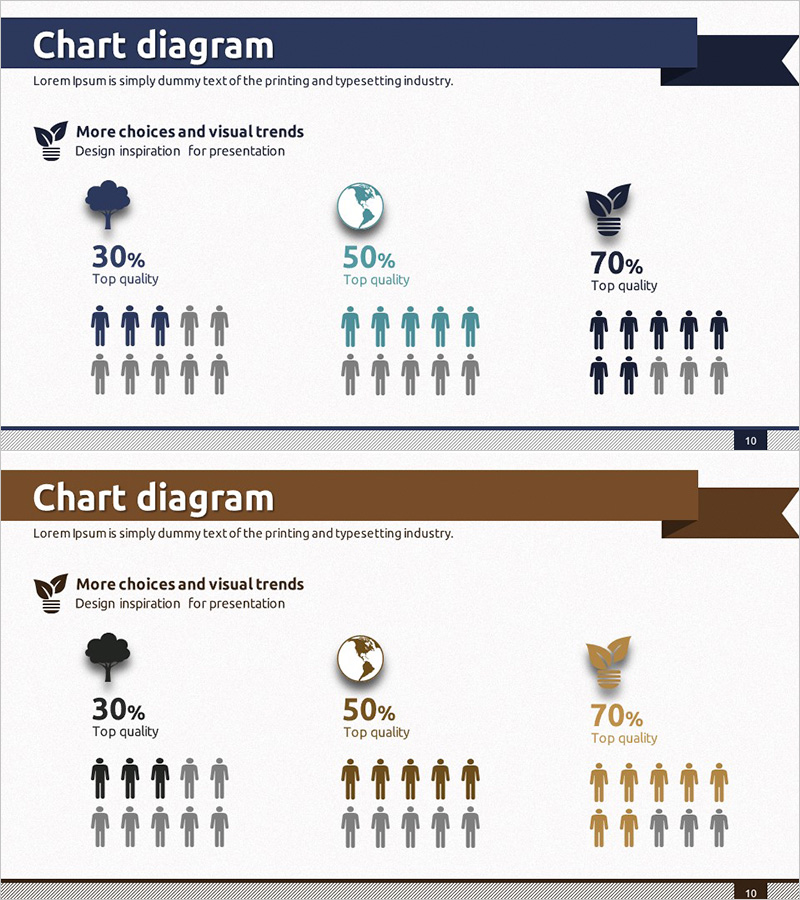
A professional ratio comparison chart PowerPoint slide designed for customer analysis and market assessment presentations. Available in three color schemes—navy, brown, and teal—each slide displays percentage data for three items using icons, human figures, and numerical values simultaneously. The generous title area at the top and descriptive text space at the bottom allow flexible customization for your presentation context. Optimized for visualizing quantitative data such as customer segmentation, market share, preference surveys, and competitive analysis.
Usage Points
-
Main Usage
Visualizes quantitative data—such as customer segmentation, market share, preference surveys, and competitive benchmarking—by dividing information into three items displayed as percentages. Communicates relative proportions intuitively and effectively supports data-driven decision-making.
-
How to Use
Enter your analysis topic in the title area (e.g., customer satisfaction, market preference, competitive strength). Input item names and percentage values for each section. Select a color scheme (navy, brown, or teal) that matches your presentation's overall tone for visual consistency.
-
Recommended For
Recommended for marketing plans, business reports, investor presentations, customer analysis reports, executive briefings, and market research presentations. Ideal for marketing professionals, planners, sales teams, executives, and analysts who need to support data-driven decisions.
-
Slide Structure
Top title input area (1 section) + three item sections with icons, human figure illustrations, and percentage displays + bottom descriptive text space. Each item can be color-highlighted independently, and the structure supports easy data modification and updates.
Related Products
-

Customer Analysis Area Chart – Data Visualization for Market Understanding
#Market and Competitor Analysis #Graph #Other
-

User Gender Ratio Analysis Diagram
#Market and Competitor Analysis #Graph #Other
-

Gender Ratio Customer Analysis 3D Circle Graph – Insights for Market Understanding
#Market and Competitor Analysis #Graph #Other
-

Running Face Graph – Market Analysis and Technology Introduction
#Technical Approach #Market and Competitor Analysis #Graph
