Environmental Protection Tree Infographic – Vision for a Sustainable Future
RJ0600015_16
- Last Update 06/24/2025
- File Size 2.8MB
- # of Slides 2
- File Format PPTX
- Slide Ratio 16:9
- Color
Keywords
- #Content-Based Slides
- #Product/Service Introduction
- #Market and Competitor Analysis
- #Development Status
- #Future Outlook
- #16:9
- #environmental protection infographic PowerPoint
- #tree diagram slide design
- #sustainability vision presentation
- #how to create environmental infographic in PowerPoint
- #tree structure data visualization slide
About the Product
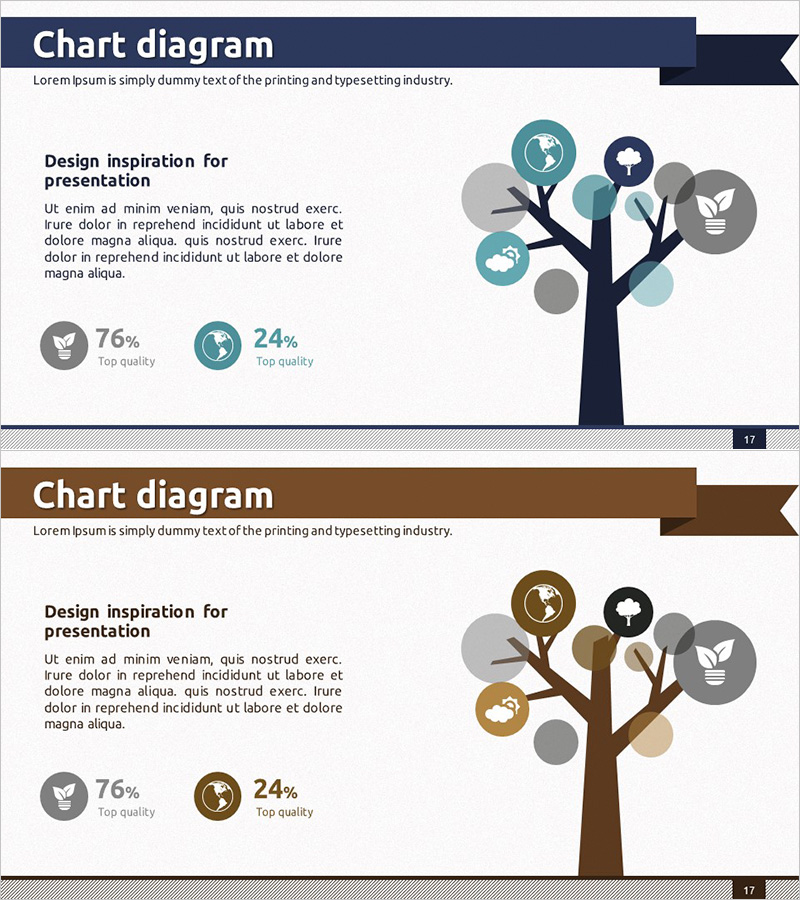
A tree-structured infographic PowerPoint slide that visualizes a sustainable future vision through environmental protection themes. Connected circular icons on tree branches represent key environmental indicators and statistics, while the left text area conveys core messages. Available in two color versions—navy blue and brown—allowing flexible selection to match corporate branding and presentation topics. Composed of 2 slides in 16:9 widescreen format, this deck is ready for immediate use in environmental policy presentations, sustainability strategy briefings, and product development updates.
Usage Points
-
Main Usage
Visually communicate corporate environmental policies, sustainability strategies, and ESG management goals. The tree branch structure with connected icons presents environmental metrics and statistics hierarchically, making complex information intuitive and memorable for audiences.
-
How to Use
Enter core messages and descriptions in the left text area, then replace the right tree diagram's circular icons and figures with your company data. Select either the navy or brown version to match your corporate brand colors, ensuring visual consistency throughout your presentation.
-
Recommended For
Environmental policy managers, sustainability report authors, product development teams, marketing planners, and investor relations professionals. Ideal for corporate vision presentations, environmental initiative introductions, and future outlook sections.
-
Slide Structure
Two-slide composition with a dual-column layout: left side features text input areas for titles and descriptions, right side displays a tree-form diagram. Five to six circular icons connected to tree branches represent key topics, with statistical figures (76%, 24%, etc.) positioned at the bottom to support data-driven presentations.
Related Products
-

Polygonal Template Vertical Bar Graph – Market Analysis and Financial Planning
#Market and Competitor Analysis #Financial Plans and Performance #Graph
-

Modern Business Plan Line Diagram – Visualizing Market Strategy
#Market and Competitor Analysis #Marketing Plan and Strategy #Graph
-

Orange & Green Future Outlook Bar Graph
#Business Strategy #Market and Competitor Analysis #Graph
-

Trends Visualized with Line Chart
#Technical Approach #Market and Competitor Analysis #Graph
