Camping Expected Return on Investment Graph – Effective Business Management
RJ0600014_12
- Last Update 06/24/2025
- File Size 0.7MB
- # of Slides 2
- File Format PPTX
- Slide Ratio 16:9
- Color
Keywords
- #Content-Based Slides
- #Design-Based Slides
- #Business Management
- #Financial Plans and Performance
- #Diagram
- #Execution Plan
- #Capital Requirements
- #Table
- #Standard Table
- #16:9
- #table chart PowerPoint slide
- #data comparison presentation template
- #3-column table design
- #business management slide
- #ROI table PowerPoint download
About the Product
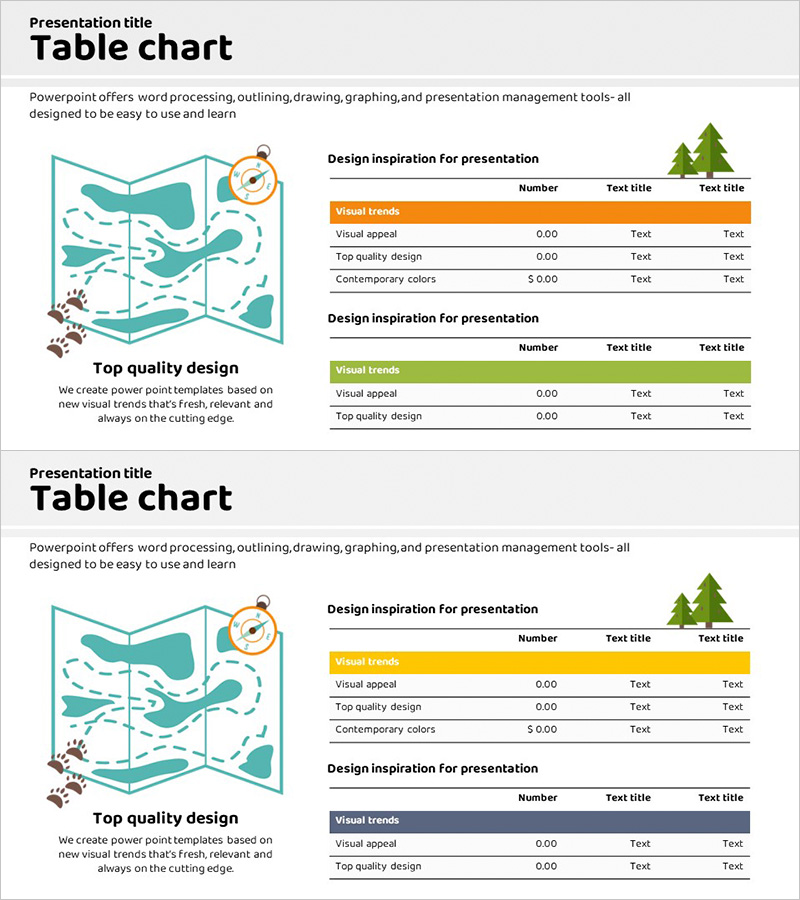
A professional table chart slide for PowerPoint presentations that organizes and compares data systematically. This 2-slide set features two table layouts with orange and green headers, each containing 3 columns (Number, Title, Content) for clear information hierarchy. The design enables quick visual comparison of business metrics, investment returns, and performance indicators. Ideal for business management, financial reports, investment pitch decks, and quarterly performance presentations. Fully editable PPTX format ready for immediate use.
Usage Points
-
Main Usage
Designed to present numerical data such as business performance, return on investment, and visual trends in organized table format. The orange and green header colors enhance visual distinction and audience engagement. The 3-column structure (Number, Title, Content) clearly establishes information hierarchy for effective data communication.
-
How to Use
Slide 1 features an orange header table; Slide 2 features a green header table. Double-click any cell to edit text directly. Add or remove rows and columns as needed, and customize colors to match your brand. Use in business plans, investment proposals, quarterly reports, and performance dashboards.
-
Recommended For
Business managers, financial analysts, marketing strategists, and investment professionals presenting numerical data. Particularly effective for ROI comparisons, cost analysis, performance metrics, market analysis, and financial forecasting in executive presentations.
-
Slide Structure
2-slide layout with left-side illustration (camping theme icons, compass, trees) and right-side table area. Each table contains 3 columns (Number, Title, Content) and 3-4 rows. Headers are highlighted with orange (Slide 1) or green (Slide 2) background for visual emphasis.
Related Products
-

Trend Color Wide Template Table – Emphasizing Financial Planning and Performance
#Financial Plans and Performance #Diagram #Capital Requirements
-

Rainbow Presentation Template Chart and Icons – Enhance Your Financial Planning
#Financial Plans and Performance #Diagram #Capital Requirements
-

Travel Budget and Expense Planning Slide
#Financial Plans and Performance #Diagram #Capital Requirements
-

Auto Business Funding Table – Maximizing Financial Efficiency
#Financial Plans and Performance #Diagram #Capital Requirements
