Triangle Template Table Chart Presentation Slide
RJ0300007_9
- Last Update 04/20/2025
- File Size 0.3MB
- # of Slides 2
- File Format PPTX
- Slide Ratio 16:9
- Color
Keywords
- #Content-Based Slides
- #Design-Based Slides
- #Financial Plans and Performance
- #Diagram
- #Capital Requirements
- #Balance Sheet
- #Table
- #Standard Table
- #16:9
- #table chart PowerPoint
- #data table slide template
- #comparison table presentation
- #4-column table design
- #financial data slide
- #business table template PowerPoint
About the Product
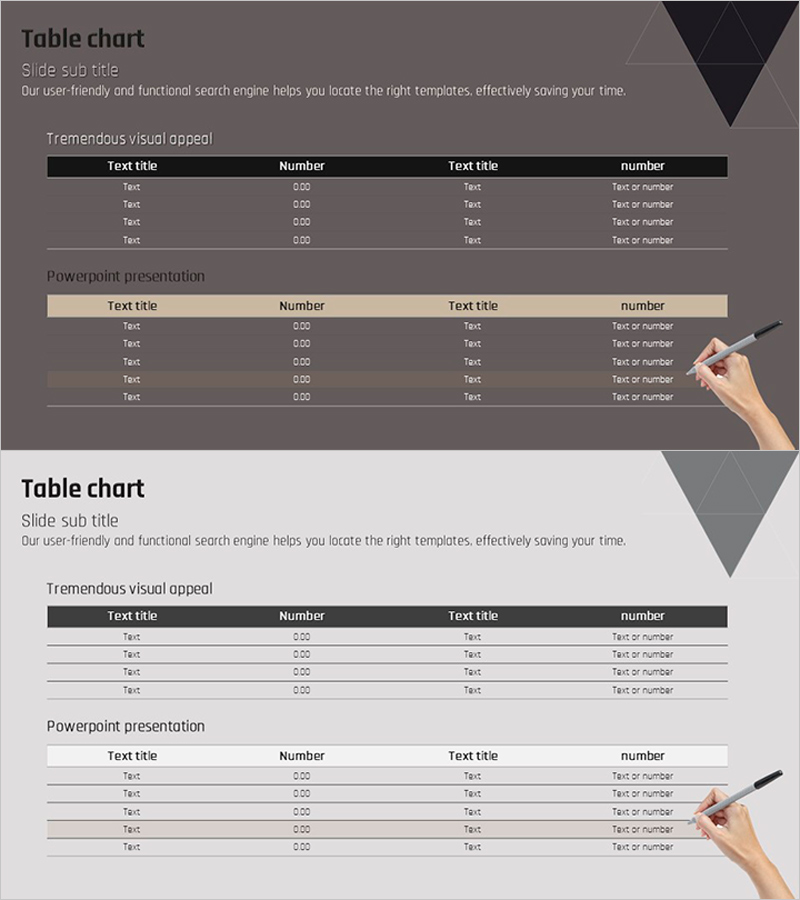
A two-slide PowerPoint template featuring table charts with geometric triangle design elements. The set includes two distinct styles: one with a dark gray background and black header, and another with a light gray background and beige header. Each table contains 4 columns and 5 rows for data entry, designed in 16:9 widescreen PPTX format. The layout enables efficient organization and comparison of text and numerical data across multiple categories. Ideal for financial reports, performance dashboards, project status updates, and business presentations requiring clear data visualization.
Usage Points
-
Main Usage
Present quantitative information such as financial metrics, performance indicators, project timelines, and cost breakdowns in a structured tabular format. The 4-column layout systematically arranges data points to enhance audience comprehension and facilitate quick comparisons across categories.
-
How to Use
Enter item names in the 'Text title' cells and corresponding numerical values in the 'Number' cells. Use the dark header style for formal executive presentations and the beige header for warmer, collaborative settings. Colors, fonts, and cell dimensions are fully editable to match your corporate branding guidelines.
-
Recommended For
Finance teams presenting quarterly earnings reports, marketing departments analyzing campaign performance metrics, operations teams sharing project progress updates, and executive leadership preparing board presentations. Suitable for any data-driven business context requiring clear numerical comparison.
-
Slide Structure
Two-slide set: Slide 1 features dark gray background with black header table (4 columns × 5 rows); Slide 2 displays light gray background with beige header table (4 columns × 5 rows). All cells support text or numeric input. Triangle geometric elements positioned in the upper right corner provide visual accent and design continuity.
Related Products
-

Table Chart and Arrow Signs
#Financial Plans and Performance #Diagram #Capital Requirements
-

Sleek Diagram and Chart Design
#Financial Plans and Performance #Diagram #Balance Sheet
-

Fund Planning and Revenue Tables – Financial Performance Analysis
#Financial Plans and Performance #Diagram #Other
-

Highlight Table Chart – Clear Visualization of Financial Performance
#Financial Plans and Performance #Diagram #Capital Requirements
