Market and Competitive Analysis with Stacked Bar Chart
RJ0600012_5
- Last Update 06/24/2025
- File Size 0.2MB
- # of Slides 2
- File Format PPTX
- Slide Ratio 16:9
- Color
Keywords
- #Content-Based Slides
- #Design-Based Slides
- #Market and Competitor Analysis
- #Graph
- #Competitive Advantage
- #Horizontal Bar
- #Segmented Horizontal Bar
- #16:9
- #stacked bar chart
- #horizontal bar graph PowerPoint
- #market analysis slide
- #competitive analysis chart
- #5-item comparison graph
- #bar chart PowerPoint slide template
About the Product
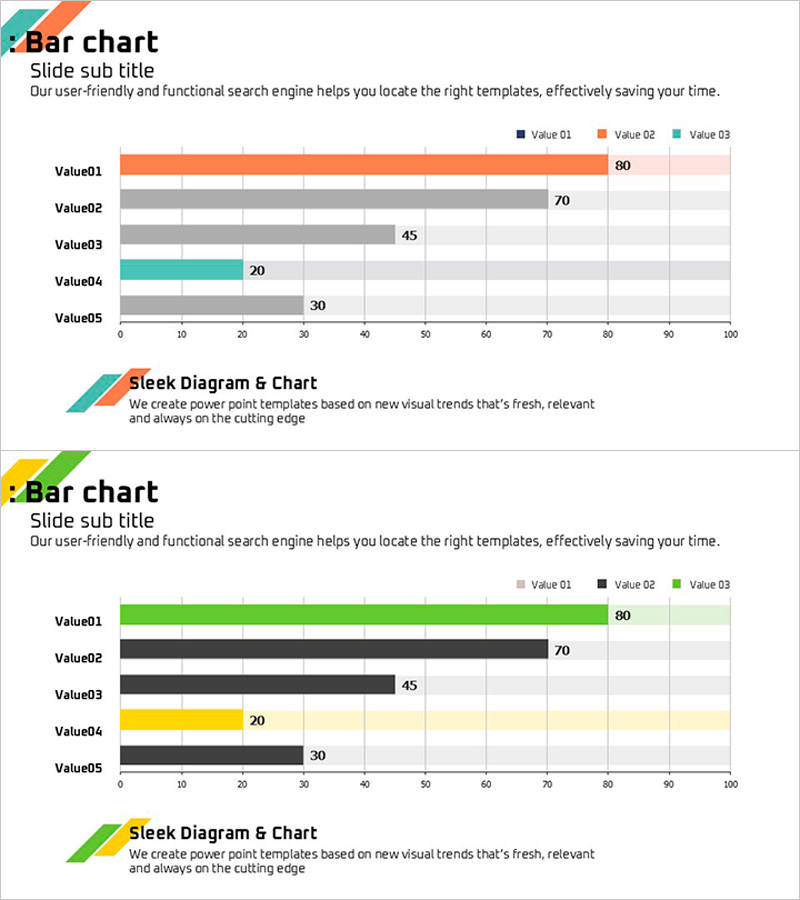
A stacked horizontal bar chart PowerPoint slide optimized for market analysis and competitive analysis presentations. This slide displays 5 items (Value01 through Value05) segmented across 3 data series (orange, gray, and teal) to show both the composition ratio and absolute value of each item simultaneously. The horizontal bar format makes item-to-item comparison clear and intuitive, while the 0–100 grid background facilitates accurate data reading. The 2-slide set includes a first slide with orange emphasis and a second with green emphasis, adapting to various presentation contexts. Delivered in 16:9 widescreen PPTX format for immediate editing and data input.
Usage Points
-
Main Usage
Visualizes complex multi-series data such as market size, market share, and competitor comparison. Simultaneously conveys both the absolute scale of each item and its internal composition, making it ideal for strategic planning and executive decision-making materials.
-
How to Use
Place this slide in the market analysis section of marketing plans, business reports, or investor presentations. Simply replace Value01–Value05 labels and series values with your actual data. Adjust color emphasis to highlight specific data series as needed.
-
Recommended For
Recommended for marketing managers, strategy planners, sales directors, and executives preparing business reports. Suitable for market entry strategy, competitive positioning, customer segmentation, and product portfolio comparison.
-
Slide Structure
2-slide set. Slide 1: 5 horizontal stacked bars with orange, gray, and teal series, legend included, 0–100 grid background. Slide 2: Same structure with green emphasis color variant. Each bar displays cumulative series segments with numeric labels for precise data representation.
Related Products
-

Geometry PPT Template Wide Horizontal Bar Segmentation Graph
#Market and Competitor Analysis #Graph #Industry Trends
-

Competitor Analysis 3D Graph Slide – How to Gain Market Advantage
#Market and Competitor Analysis #Graph #Competitor Analysis
-

Segmented Bar Graph for Market Competition Analysis – Data-Driven Insights
#Market and Competitor Analysis #Graph #Market Analysis
-

Comparative Analysis Detailed Bar Graph – Optimal Tool for Competitor Analysis
#Market and Competitor Analysis #Graph #Competitor Analysis
