Market Share Donut Pie Chart - Harmony of Data and Feel
RB0100001_7
- Last Update 02/28/2025
- File Size 3.6MB
- # of Slides 2
- File Format PPTX
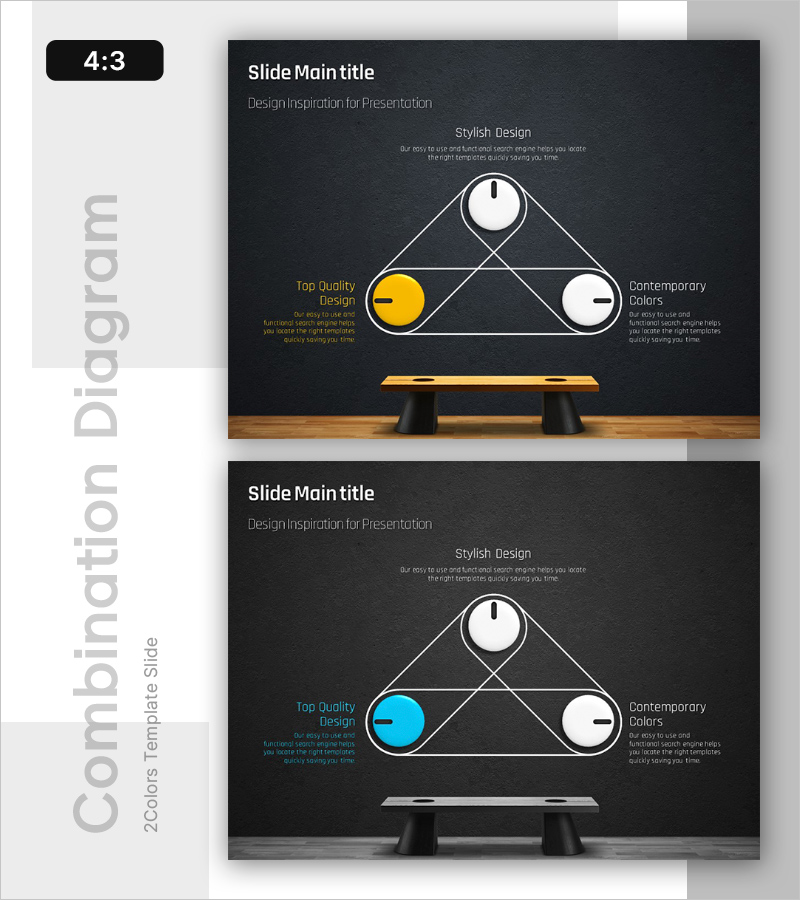
- Slide Ratio 4:3
- Color
Keywords
- #Content-Based Slides
- #Design-Based Slides
- #Technical Approach
- #Diagram
- #Service Development Plan
- #Service Configuration Plan
- #Cluster
- #Combination Diagram
- #Chain Diagram
- #4:3
- #pie chart PowerPoint slide
- #3-segment donut chart template
- #market share diagram
- #balanced node structure
- #data visualization slide
- #business analysis template
About the Product
A balanced three-node pie chart PowerPoint slide designed for data comparison presentations. The dark charcoal background features white connecting lines forming a triangular structure with three circular nodes: white at the top, gold on the left, and white on the right. This layout effectively visualizes market share distribution, competitive positioning, and resource allocation across three key segments. The 4:3 aspect ratio template includes two slide variations with different accent colors, enabling flexible data representation for business analysis, strategic planning, and financial reporting. Text areas are clearly positioned for quick content integration.
Usage Points
-
Main Usage
Visualizes proportional relationships among three key business elements with balanced geometric structure. Ideal for market share analysis, competitive benchmarking, resource distribution, customer segmentation, and product portfolio composition in executive presentations.
-
How to Use
Input numerical data and labels into each node to represent three-way proportional comparison. The gold accent node highlights the primary metric, while high-contrast dark background ensures clarity in projection environments. Easily customize colors and text for different data scenarios.
-
Recommended For
Marketing managers, business development professionals, financial analysts, management consultants, and executives preparing strategic reports. Suitable for market analysis, investment reviews, business proposals, and data-driven decision-making presentations across industries.
-
Slide Structure
Two-slide template with first slide featuring gold accent node and second slide with cyan accent node. Each slide includes title area at top, central three-node diagram, and left-right text annotation zones for balanced information layout.
Related Products
-

Business Area Overlay Diagram – A Blend of Visual Appeal and Functionality
#Company Introduction #Business Introduction #Diagram
-

History Overlay Diagram – Company Introduction Slide
#Company Introduction #Diagram #History
-

Overlay Diagram for Cell Properties
#Business Vision and Strategy #Marketing Plan and Strategy #Diagram
-

Historical History Diagram by Year – Business Strategy and Vision
#Company Introduction #Business Strategy #Diagram
