Consumption Status Comparison Chart – Essence of Market Analysis
RJ0600008_17
- Last Update 06/23/2025
- File Size 0.1MB
- # of Slides 2
- File Format PPTX
- Slide Ratio 16:9
- Color
Keywords
- #Content-Based Slides
- #Design-Based Slides
- #Market and Competitor Analysis
- #Graph
- #Competitive Advantage
- #Horizontal Bar
- #Double Horizontal Bar
- #16:9
- #dual bar chart PowerPoint
- #bilateral comparison graph template
- #consumption analysis slide
- #market analysis chart
- #symmetric data visualization PowerPoint
About the Product
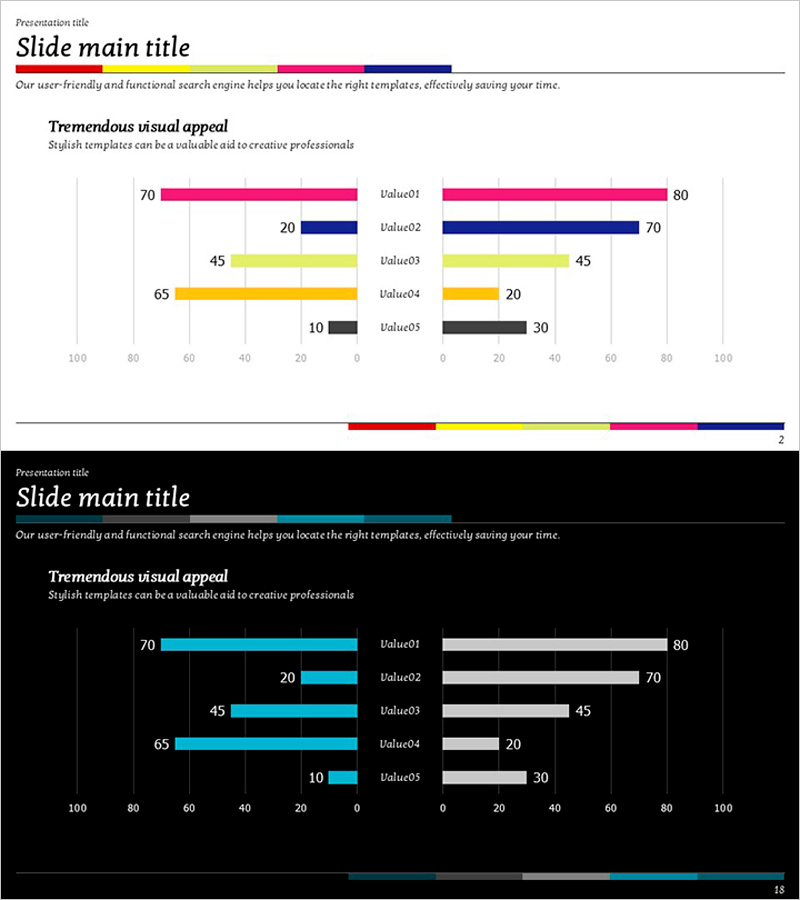
A dual-sided bar chart PowerPoint slide designed to compare consumption status and market analysis data side by side. The slide features five items displayed symmetrically on the left and right, with distinct color coding in magenta, navy, yellow, and gray to differentiate each data series. Ideal for competitive benchmarking, market share analysis, consumer preference surveys, and any presentation requiring bilateral data comparison. Provided in 16:9 widescreen format across 2 slides, fully editable for immediate use.
Usage Points
-
Main Usage
The symmetrical dual-sided bar chart structure enables simultaneous comparison of two data series across five categories. Perfect for competitive analysis, market share benchmarking, consumer preference studies, and strategic positioning presentations where side-by-side data contrast is essential.
-
How to Use
Double-click each data value in the chart to edit numbers directly; the chart updates automatically. Modify colors via the Design tab, customize category labels and legend text as needed. The slide supports step-by-step animation playback during presentations via mouse click.
-
Recommended For
Marketing managers, sales strategy teams, market research analysts, executive reporting specialists, consulting firms. Recommended for consumption trend analysis, competitive advantage assessment, market entry strategy presentations, and business performance reviews.
-
Slide Structure
2-slide deck. Slide 1 is a title slide; Slide 2 displays the dual-sided bar chart with 5 left-side items (values: 70, 45, 65, 10) and 5 right-side items (values: 80, 70, 45, 20, 30) differentiated by magenta, navy, yellow, gray, and black. Numeric labels appear above each bar, with a color legend positioned at the bottom.
Related Products
-

Simple Circle Presentation Template Bilateral Bar Graph
#Market and Competitor Analysis #Graph #Competitive Advantage
-

Competitor Analysis and Advantage Chart – The Harmony of Blue and Red
#Market and Competitor Analysis #Graph #Competitor Analysis
-

Competitor Product Analysis and Competitive Advantage Bar Chart – Market Share Comparison
#Market and Competitor Analysis #Graph #Competitor Analysis
-

Sales Comparison Graph by Product – Competitive Advantage and Performance Analysis
#Market and Competitor Analysis #Financial Plans and Performance #Graph
