Table Highlight Slide – Visualizing Business Strategy
RJ0600008_15
- Last Update 06/23/2025
- File Size 0.1MB
- # of Slides 2
- File Format PPTX
- Slide Ratio 16:9
- Color
Keywords
About the Product
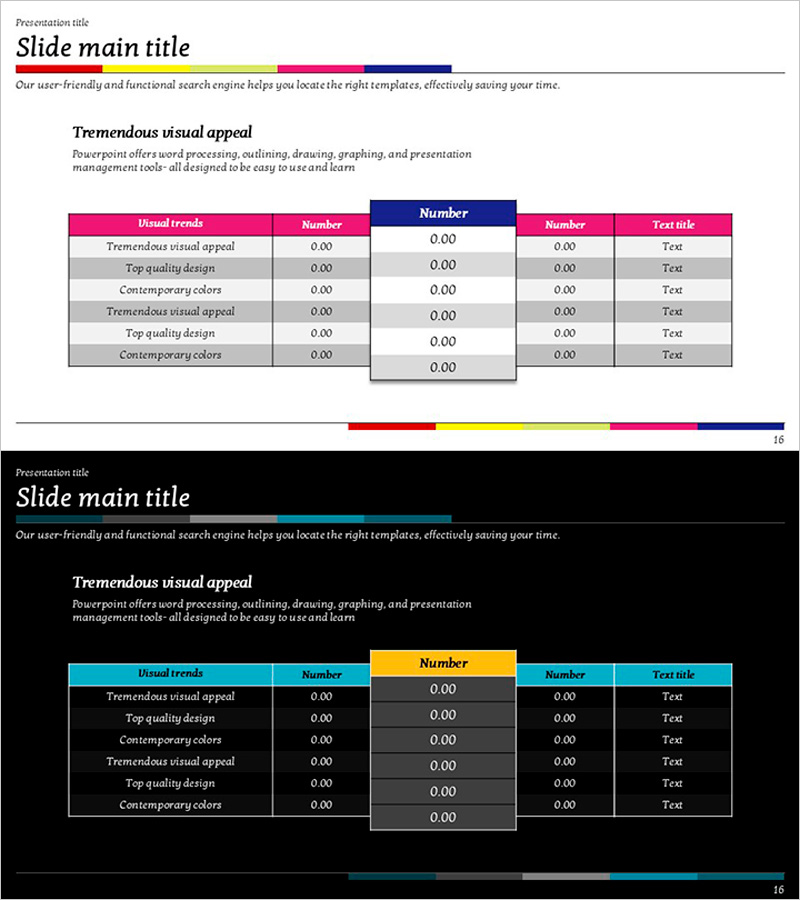
A table highlight PowerPoint slide designed to visualize business strategy and competitive analysis with clarity and impact. The slide features a 6-row by 5-column multi-row structure with pink, navy, and gray color accents that emphasize key data points. Text input areas and numerical data cells are distinctly separated, allowing you to present financial metrics, performance comparisons, and competitive benchmarks effectively. This ready-to-edit PPT slide reduces presentation preparation time while maintaining professional data visualization standards.
Usage Points
-
Main Usage
Designed to organize and compare complex data and numerical information in table format for quick analysis and decision-making. Presents competitive benchmarks, performance indicators, financial data, and market share information with clarity, using pink and navy highlight colors to draw attention to critical data points.
-
How to Use
Enter category names in the text input areas and populate each cell with numerical data. Place data requiring emphasis in pink and navy background cells to direct stakeholder focus. Use this slide in business strategy presentations, executive briefings, investor pitch decks, and competitive analysis reports.
-
Recommended For
Ideal for finance teams, strategy departments, and marketing teams presenting performance analysis, competitive comparisons, and market insights. Suitable for business plans, quarterly reports, investor relations presentations, and executive briefings where data-driven decision-making is essential. Applicable to any business presentation requiring structured information delivery.
-
Slide Structure
6-row by 5-column multi-row table with pink-background category headers in the first row, navy-background key metric labels in the second row, and gray/white background cells for data entry in remaining rows. Each cell accommodates numerical and text input, with color-coded emphasis creating clear information hierarchy.
Related Products
-

Paper Theme Table Chart & Bar Graph – Market Analysis and Competitive Strength
#Market and Competitor Analysis #Diagram #Graph
-

Chart Analysis of External Activities – Performance and Strategy
#Company Introduction #Business Strategy #Diagram
-

Medical Business Linear Diagram – Competitiveness Analysis
#Market and Competitor Analysis #Diagram #Competitor Analysis
-

Global Network Market Analysis Table – Visualization of Data and Performance
#Business Strategy #Market and Competitor Analysis #Diagram
